Dan Barnes speaks with Terry Flanagan about the market volatility and the impact of the US Presidential election.
Me The Money Show Episode 20 from Markets Media on Vimeo.
©Best Execution & TheDESK 2020
TOP OF PAGE


Dan Barnes speaks with Terry Flanagan about the market volatility and the impact of the US Presidential election.
Me The Money Show Episode 20 from Markets Media on Vimeo.
©Best Execution & TheDESK 2020
TOP OF PAGE


European asset managers showed resilience despite a 9% drop in revenues and a 1.5% dip in assets under management to €10.4 trn in the first half of 2020 compared to the same time frame last year, according to Moody’s Investors Services. latest semi-annual update on the sector,
The average EBITDA margin of independent asset managers within Moody’s surveyed group fell to 27% during the first half of 2020, from 30% in the second half of 2019. The decline reflects lower management fees during the period while costs remained broadly unchanged.
The ratings agency said that a slump in financial markets in the first quarter was largely reversed in the second quarter thanks to the unprecedented help of central bank intervention and widespread government stimulus that boosted global equity markets.
Overall, while there were net outflows in the first quarter, investors put more money in than they withdrew in the second quarter. Moody’s noted that the main beneficiaries were mainly money market and fixed income products, reflecting investor caution.
Sustainable investing has also emerged as a strong trend during the first half. While European funds reported net outflows of €125 bn overall during the first quarter, sustainable funds attracted €26 bn of net inflows, according to Morningstar data.
Moody’s cautioned that the rest of the year could be difficult given a spike in cases in many jurisdictions, leading to tighter restrictions in countries such as the UK, France and Spain. Recovery could be further threatened by a no deal Brexit.
“The positive performance of financial markets since the first quarter of the year means management fees and margins could recover in the second half of the year,” said Marina Cremonese, a vice president and senior analyst at Moody’s. “However, we remain cautious as market risk is still high given the slower than anticipated economic recovery from the initial coronavirus shock, as well as the strong resurgence of Covid-19 cases.”
In general, European markets have performed less well than those in the US. The FTSE 100 is currently around 25% down from its pre pandemic levels while Eurostoxx 600 is back to its mid-March levels but still down 7% for the year.
@BestExecution 2020
[divider_to_top]
")
Markets Media Group and GlobalTrading announced the second-annual Women in Finance Asia Awards in a Sept. 24 virtual event.
A video of the event will be posted on GlobalTrading in the very near future.
Congratulations to the winners!
Rising Stars
Liesbeth Baudewyn, Systematic Trader, Citadel
Carrie Cheng, Trader, BNP Paribas
LeiLei Qu, Quant Research, JPMorgan Asset Management
Best in Exchanges
Joelle Yap, Director – Client Development and Sales, CME Group
Best in Custody
Angely Yip, Head of Sales and Relationship Management, North Asia, BNP Paribas Securities Services
Best in Operations
Edna Chan, Director, Asia Pac Head of Cash Equities Middle Office, Citigroup Global Markets Asia Limited
Best in Fintech
Rebecca Sin, Head of Equities, Asia, Tradeweb
Excellence in Trading Platforms
Janice Lau, Executive Director, ET, Instinet
Excellence in Buy-Side Trading
Cheryl Chan, Equity Trader, BlackRock
Excellence in Sell-Side Trading
Mary-Anne Peril, Head of Execution Services Australia, Virtu Financial
Best in Hedge Funds
Elizabeth Lo, Chief Operating Officer, TX Capital
Trailblazer
Winnie Khattar, Head of Market Structure, BofA Securities
Crystal Ladder
Susan Chan, Head of Asia, and Head of ETFs & Index Investing and Trading and Liquidity Services Asia-Pacific, BlackRock
Individual Achievement
Erica Poon Werkun, Head of Securities Research Asia Pacific, Credit Suisse
Excellence in Leadership
Terecina Kwong, Chief Operating Officer, HSBC Europe, HSBC
CEO of the Year
Susan Soh, Singapore CEO and Co-Head of Asia Pacific, Schroder Investment Management (Singapore) Limited
Lifetime Achievement
Cecilia Chan, CIO Fixed Income, Asia Pacific, HSBC Asset Management

The following article first appeared as FLASH FRIDAY on Traders Magazine. FLASH FRIDAY is a weekly content series looking at the past, present and future of capital markets trading and technology. FLASH FRIDAY is sponsored by Instinet.
By Chris Hall
We all know you can’t turn back the clock. And you can’t put the genie back in the bottle. But European regulators are attempting to pull off something similar by partially reversing a ban on bundled research and execution payments, causing confusion and uncertainty over here in the US.

“Exempting small-cap stocks from the research unbundling is the equivalent of trying to put the toothpaste back in the tube,” said Mett Kinak, global head of systematic trading and market structure at T Rowe Price.
Having codified the global shift toward full separation of research and execution payments, with the introduction of MiFID II in 2018, the European Commission unveiled proposals in July to water down its own regulations on research payments.
Consultation on the plans – issued as part of a package to support the recovery of European businesses from the economic impact of the Covid-19 pandemic – closed earlier this month. Many are keen for the release of more details, including the US Securities and Exchange Commission (SEC), ahead of the rules coming into force, which is expected early next year.
By exempting research on firms with a market capitalization below €1 million ($1.15 million) from MiFID II’s unbundling rules, the intention is to increase the availability of research into small- and mid-cap stocks, thus stimulating much-needed investment flows.
MiFID II has had extra-territorial consequences, crystalizing evolving best practice at major asset management firms, and leading to a global consensus that research must be paid for directly by the asset manager, separate from trading commissions, and not passed on to the end-investor.
—
Rewind a few years — an April 2017 article published in Traders Magazine gave the state of play at the time:
“The incoming rules separating payments for trading and research in the European Union will expand beyond the region and are likely to boost full unbundling of client commissions around the world.
MiFID II, the regulations covering financial markets in the EU, come into effect at the beginning of next year. One of the requirements of MiFID II is to separate payments for research from trading commissions to increase transparency and reduce conflicts of interest. Asset managers will have to either pay for research out of their own P&L or from research payment accounts, where they have agreed a budget with their clients. The requirements cover fixed income, currency and commodity markets for the first and the buyside will also have to track their consumption of research and evaluate its quality.”
—
US-based investment firms were permitted to effect this change via no action letters issued by the SEC, due to expire July 2023, which allow broker-dealers to receive payments for research from investment firms if the latter are required by MiFID II to unbundle. This means many US-based asset managers now pay for their own research at home and abroad. T Rowe Price, for example, has been paying for all its own research costs globally, either directly or by reimbursement, since the beginning of 2020.
It is possible that the proposed exemption for research into small- and mid-cap stocks could conflict with the requirement on which the SEC’s no action letters are based. And, having recently explained the initial shift to end-investors, some heads of trading are not looking forward to telling institutional clients that they may need to pay for research when investing in funds registered in one jurisdiction, but not if investing in funds registered elsewhere. Others are more sanguine.
“It can be a little confusing and time-consuming, in terms of what you pay to whom and where. Ideally, you’d like it to be more consistent, but as regulations change you just have to adapt,” said David Lewis, head of global equity group trading at Franklin Templeton.
In January, a report by the French financial market regulator, the AMF, blamed MiFID II for declining research coverage in smaller companies. Earlier this month, a report by the European Securities and Markets Authority asserted that MiFID II had had no meaningful impact, citing a study which found there had been a steady decline in research coverage since 2012.
In MiFID II’s pre-legislation consultation period, many across the industry expressed fears that the introduction of greater transparency in research payments could reduce the availability of small- and mid-cap research, with inevitable knock-on consequences for liquidity and spreads.
“Pre-MiFID II, we argued vehemently that small-cap stocks should not be bound by the new unbundling rules, because that was where research would be hit hardest and is most needed. Now we’ve unbundled and we’re paying for our own research, and there are proposals suggesting it’s ok for our clients to pay for small-cap research,” explained Kinak.
The European Commission’s proposed exemption may mark a wider change in tone, according to Tim O’Halloran, managing director at Tourmaline Partners, a provider of trading and commission management solutions. “The broad regulatory trend over the past 5-10 years has been toward unbundling, greater transparency and a competitive research marketplace. This sends a message that commissions are still going to be the currency of exchange for research in some capacity.”
But Mike Kronenberg, co-founder and CEO of Analyst Hub, a platform for independent research providers, predicts that the proposed exemption will have minimal initial impact on the largest asset managers. “Institutional buy-side firms have put very strict policies in place,” for the onboarding of research, he said. “For the top commission payers, those policies and procedures are going to remain, with perhaps a relaxation for one or two specialist portfolio managers.”
There is also a political dimension which could make the picture even more complicated for global asset managers operating across multiple jurisdictions. With the UK potentially leaving the European Union without a trade agreement at the end of this year, it is highly unlikely that the Financial Conduct Authority would implement the European Commission’s proposed changes to MiFID II. Much of the initial impetus behind the separation of execution and research costs came from the UK regulator’s predecessor. This means funds registered in the departing UK may stick to MiFID II’s original intentions, whilst the remaining EU-27 row back.
The British might describe this as irony. Kinak calls it confusing. “With Brexit looming, there’s potential for even more divergence of regimes, with UK-registered entities subject to different rules from European ones. Clearly, that would make for further complexity,” he said.
A spokesperson confirmed to Traders Magazine via email that the Commission is currently analyzing consultation responses to decide whether additional changes should be inserted in the draft text. “The final rules on research will be adopted shortly,” the spokesperson said.
Chris Hall is a Senior Correspondent for Traders Magazine. Chris can be reached at cmehall@btinternet.com

Market volatility ahead of the US election: Operational resilience is just as important as your trading strategy
By Guy Warren, CEO, ITRS Group
Market volatility has been the order of the day in 2020, as firms across the globe react instantly to the latest developments, whether that be Covid-19, the global economic downturn or geopolitical tensions. This volatility shows no signs of letting up, with the uncertainty around this year’s presidential election stoking yet another wave of uncertainty.
What is causing this volatility? The markets always experience turmoil in an election year, as investors hedge their bets on the outcome of the election, but this year the volatility is much greater. A key driver of this is of course Covid-19 and the resulting global economic downturn. With investors adverse to high levels of risk in the current climate they are constantly readjusting their portfolio to minimise their exposure. A key example of this is the recent dump of tech stocks over the past month, with investors worried about over-valuation and potential legislation breaking up big tech.
On top of this foundation of economic uncertainty, the specifics of this years election enhances volatility due to the close nature of the race, alongside the significantly different platforms of both sides. Investors have also been unsettled by rhetoric around mail voting and a potential delayed vote count due to high levels of mailed in ballots.
In the face of this volatility, firms must prioritise operational resilience, which is their ability to prevent, adapt, respond to and recover from disruptions. In this case, it is preparing their trading and IT infrastructure to be able to withstand high levels of volume, in order to ensure their systems don’t overload and face an outage.
It’s remarkable the number of companies out there that still don’t know how many trades they are able to process in a day. This big blind spot means their systems are unprepared for increased volatility. The consequences of experiencing an outage are huge, with clients at risk of losing millions, with the resulting reputational damage being severe.
What can be done to maximise operational resilience and minimise the chance of an outage? Firms must get visibility of their IT estate. This will allow them to identify their headroom (how many trades their system can handle in a day) as well as the specific pinch points and bottlenecks of their system.
At a more advanced level, using the right software tool firms are able to model and stress test worst case scenarios, which then enables firms to put plans in place to deal with them. For example, if a firm has just experienced a 4x day, they can model a 6x or 8x day, enabling them to prepare their systems for this eventuality.
As we get closer to the election, the financial sector is putting more time into their investment strategies, but alongside this they must also invest time and money into ensuring their systems can cope with high levels of volatility. The sooner you get a full view of your systems, the sooner you’ll be able to be ready for the unknown.

By Phil Mackintosh, Chief Economist, Nasdaq
The recent splits of AAPL and TSLA drew a lot of media attention. A common comment was “splits don’t change the stock fundamentals, so they shouldn’t affect valuation.”
But that’s not true. Splitting fundamentally changes how stocks trade. That can make it cheaper for investors, improving their returns. In turn, when investor returns increase, stock valuations should outperform.
In fact, seemingly small things like market structure and trading costs are important to the economy.
Splits help stocks trade higher
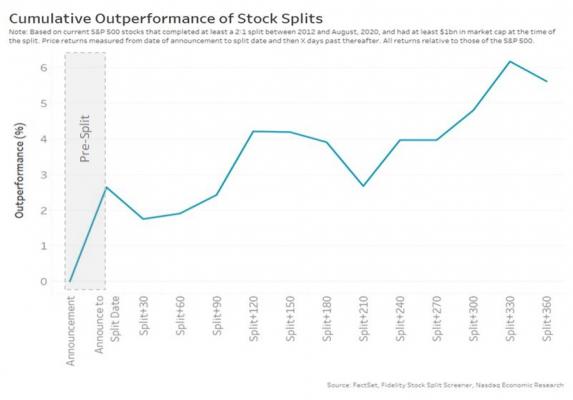
Quite a lot of academic research shows that stocks that split tend to outperform the market. We updated these studies with newer data. What we found was (still) a compelling case for stock splits.
Overall, large cap stocks that split outperform the market by an average of 5% over the next 12 months. Just announcing a split causes the average stocks to outperform the market by 2.5%, indicating the market expected gains even before tradability improves.
That’s consistent with academic research in 2009 that found that liquidity improvements following stock splits reduced average companies cost of equity capital by 17.3%, or 2.4 percentage-points per-annum. This is a material boost to both issuers and investors.
Chart 1: On average, stocks doing splits outperform the market as soon as the split is announced and even more over the next 12 months
Trading for investors gets easier and cheaper
A big question we get is, “Why would a split make trading easier?”
Let’s start by looking at the factors that make trading more expensive. There is established literature and models that measure what causes market impact. Overall, there are three main factors as that drive most trading costs:
Continually measuring and recalibrating using actual trading data by the TCA industry confirms this.
Over a longer timeframe, research also shows that impact costs have been falling for decades. That’s in part to spreads falling and liquidity increasing market-wide. You can also see that ITG (now Virtu) estimates that smaller stocks—which tend to have less liquidity, wider spreads and more volatility—also cost more to trade.
Chart 2: Tradability metrics mostly improve

Looking at these tradability metrics for stock-split tickers in Chart 2, we see that on average:
Those changes all contribute to lower trading costs. And when costs go down, returns go up, and valuations increase.
Chart 3: Reducing trading costs should increases valuations as it increases net returns

One counterintuitive finding is that close-to-close volatility increases. Interestingly, academics agree and despite numerous studies, they are unable to find a definitive answer. In any case, intraday volatility is more important for traders, as orders are worked during the day, so lower intraday volatility will attract more liquidity providers and reduce impact costs.
Why does stock price affect tradability?
The answer to this question actually requires some understanding of market structure and trading rules.
It starts from the fact that in the U.S., all stocks trade under a very similar set of rules and sometimes that “one size fits all” approach results in very different trading. We highlight two specific rules that seem to matter the most: Tick sizes and round lots.
At a very basic level:
Chart 4: Ticks and Round lots change as stock prices increase

Artificially wide spreads will also get incorporated into portfolio manager models that determine after-cost alpha. That may, in turn, deter new investors or at least reduce the size of position they decide to buy.
The one-cent tick problem
So, how exactly does the one cent tick become a trading problem?
A tick is the minimum price increment that orders can use. In the U.S., all stocks have a tick of one cent. For example, you can bid $10.01 or $10.02 but not in between.
That one-cent-tick represents a very different cost for a $5 stock (20bps) than a $500 stock (0.2bps).
For low priced stocks, that means spreads can be “expensive” for investors to cross. We’ve shown before that that causes more investors to form in longer queues, or engineer queue priority solutions like paying for inverted venues or using mid-point orders. All of which adds to liquidity fragmentation and trading complexity.
But we’re more focused here on how ticks distort trading in high priced stocks.
Chart 5: High priced stocks have more tick levels and more odd lots inside the round lot, even if the market depth is exactly the same

Using the example stock in Chart 5 we compare a $1,000 and a $100 stock with exactly the same trading liquidity.
The upper chart shows that ticks on a $1,000 stock are worth just 0.001%. Even the most liquid companies in the U.S. markets have a spread closer to 0.01%. All those increments reduce the cost of jumping in front of (or “pennying”) buyers already in line (new buyer = green box). That penalizes the original buyer, who may miss fills, without really improving prices for those wanting to sell or reported spreads.
The round lot problem
The top chart in Chart 5 also highlights how high priced stocks have a round lot problem.
Almost all stocks in the U.S. also have a concept of a “round lot,” which is 100 shares. Historically that was designed to reduce paperwork on settlement and also ensure that benchmark spread prices reflected a meaningful trade value.
Because of that history, odd lots aren’t treated the same way as round lots.
Round lots are the prices the public see; they set the official spread that institutional investors use to compute trading costs, and they are “protected,” which means traders cannot skip over them to trade elsewhere (including off exchange).
In contrast, odd lots are neither visible nor protected on the consolidated data feed. That can increase costs for large buyers in two ways:
Round lots can also artificially widen spreads. As we show in Chart 4, the value of a round lot increases as price increases. Research we’ve done shows that supply and demand (the V-shape of bids and offers in Chart 5) is typically the same regardless of tick size. However, when the stock in the upper chart is split 10:1, the 50-share ($50,000) odd lots become round lots, automatically adding to the official quote and cutting the spread for the $100 stock in the lower chart in half.
More importantly, with larger increments and smaller round lots in the second part of Chart 5, an investor looking to bid ahead of existing buyers now needs to materially improve the spread (green box), and materially tightening the spread for sellers.
In fact, stocks trading with spreads around 1-2 ticks wide generally have relatively low levels of odd lots inside the official quote (Chart 6, yellow tickers). However, as prices climb, so too does the number of ticks between the bid and offer (black dots) and the probability that the true best bid and offer is an odd lot (diagonal slope of the grey dots). This also shows that the higher the stock price the worse the odd lot problem becomes.
Chart 6: Odd lots increase as stock prices climb as spreads trade 5-cents wide, which happens mostly for stock prices above $100

Even regulators know high priced stocks are a problem for traders
It’s not just Nasdaq saying this.
Regulators have also heard from investors about how hard it has become to trade high priced stocks and have also started to act.
Chart 7: SEC proposal to change trading rules for high priced stocks creates displayed but unprotected exchange quotes, allowing dark pools to ignore exchange liquidity at better prices

This lack of splits is not normal
It would be easier for all traders if stocks traded with roughly the same prices.
That’s probably why from 1930 to 2007 stock splits were so normal that stock prices held in a consistent range around $40 per share. Before 2007 it was rare for the S&P500 to have more than a few stocks over $100. Now there more than 100 (around a quarter of the index).
So the lack of stock splits is a relatively new phenomenon; it is decidedly not normal.
It seems to have been triggered around 2007, when Reg NMS was finalized. Those new trading rules helped make markets truly electronic and interconnected. That happened as markets were adapting to decimalization, which allowed spreads to collapse to that one-cent level.
Now, many share prices have climbed well past the levels where a one-cent tick remains a constraint. Instead, an increasing proportion of trading is happening away from exchange prices (Chart 8). That may ultimately harm price discovery and market efficiency and widen spreads further.
Chart 8: Exchange quotes make up less than half of all trades

What is the perfect stock price?
When put on a chart, spreads form a ‘U’ shape, where a moderate stock price has the best spreads, for almost all stocks (orange line in Chart 3). However, the bottom of the ‘U’ changes as liquidity falls. That means every stock has its own perfect stock price.
Chart 9: Perfect stock price depends on your daily liquidity (value traded)

The data in Chart 6 and Chart 4 use the same colors where tick constrained stocks are blue, stocks with too many ticks are black, and stocks with ticks that are “just right” are in yellow.
Interestingly, when you look at all stocks ranked by liquidity (Chart 6) you see the yellow stocks also typically have the best spreads (closest to the brown line). Spreads on other stocks seem to be consistently, and unnecessarily higher.
So calculating the perfect stock price is now a simple process of translating the spreads for your stocks liquidity into one or two ticks. For example, a stock trading around $10 million in notional value per day should target a 10bps spread. With a one-cent tick, that converts to a $10 to $20 stock price.
It’s interesting to compare the two most liquid stocks in the U.S.: AMZN and AAPL. Both trade around $10 billion each day, but spreads of AAPL sit very near the “optimal” brown line and odd lots are much lower. That seems to confirm that AAPL keeping its stock price just over $100 helps keep all investors more equal and make its stock easier to trade.
Splits fundamentally improve tradability and that boosts valuations
In short, tradability matters because it affects trading costs. The market’s reaction to stock splits, on announcement date, confirms that traders know costs matter to longer term valuations.
The fact that many IPOs price around $20 to $40 per share shows that investment bankers intuitively know where perfect stock prices lie too.
But the sweet-spot is different for every stock. It’s a point where ticks are not too wide and not too narrow.
What’s unusual, given all the benefits, is that stocks splits have become so unpopular in just the last decade. Let’s hope that changes.

As of Sept. 25, volumes at Members Exchange were about doubling every day since it launched on 21 September and 32 clients have traded.
MEMX became the fifteenth US equity exchange when it debuted with the trading of seven symbols. Jonathan Kellner, chief executive of MEMX took part in a webinar last week with Shane Swanson, senior analyst at consultancy Greenwich Associates.
Kellner said: “We are excited about progress.”
The chief executive said in a blog that MEMX’s first trade was executed at 7:48:43 AM, 100 shares of ED at $73.90. On the first day MEMX traded 60,957 shares on 857 executions with 25 firms executing trades.
Thank you to everyone who participated in the first day of trading at MEMX. With seven symbols live, approx. sixty thousand shares were traded by 25 firms. Learn more about day 1 from our CEO, Jonathan Kellner:https://t.co/xSKRpvArC2 pic.twitter.com/3IA2C8qgtS
— MEMX (@memxtrading) September 22, 2020
Swanson said MEMX volumes had doubled each day since launch and volumes yesterday were around 80,000 shares for the seven symbols.
More than 40 clients had connected and 32 had traded ahead of all National Market System listings trading next week according to Kellner. He continued that the exchange wants to attract diverse liquidity providers and expects close to 50 clients to be connected shortly.
Kellner described the experience of going live during the Covid-19 pandemic as “challenging” due to some supply issues and integrating with vendors during the lockdown.
However, the exchange has been built in the cloud, hired experience personnel and staff already used communication technology such as Zoom and Slack.
“We have hired 30% of our staff since March 11 on Zoom,” added Kellner. “In the last month it has been harder to work remotely as people needed to go into data centres but the team has done incredibly well.”
The exchange had tested remote working on March 11 and since then staff worked from home as restrictions were put in place to combat the pandemic.
“You can do testing but there is nothing like real thing,” Kellner added. “In testing it is hard to run all the strategies together and see how interact with one another.”
@GreenwichAssoc and @memxtrading this Thursday. Seats are filling up – Register Today –> https://t.co/mYAhGmxwmo pic.twitter.com/HOWl0zVPso
— Coalition Greenwich (a division of CRISIL) (@CoalitionGrnwch) September 21, 2020
MEMX was formed last year by a group of financial firms.
Kellner said the exchange did not believe the US equity market was broken, but needs more competition. He added: “Nearly all, 97% of exchange flow goes to three companies. There could also be more technological innovation and by building from scratch we can put pressure on other exchanges.”
He continued that the new exchange could also put pressure on market data and connectivity fees.
“The most important reason we were formed is for engagement,” Kellner added. “Our members desired to have a voice in market structure debate.”
This month MEMX unveiled its inaugural fee structure with no pricing tiers or charges for market data or connectivity. Members pay 25 cents per 100 shares to remove liquidity. Liquidity adders will be rebated 29 cents per 100 shares for displayed volume and 20 cents per 100 shares for non-displayed, including mid-point, volume.
“There is introductory aggressive pricing to attract flow,” said Kellner. “We will eventually move to normalized pricing and hope to retain share due to our technology and member experience as we were formed as a for-profit company.”

He added that MEMX is not competing in the arms race to be the fastest exchange but is battling over determinism and consistency, while using technology to reduce costs. As result MEMX has a limited number of order types.
“We want to simplify the market and use technology to make it more efficient,” said Kellner. “We do not intend to increase the number of order types but we would never say never.”
Kellner continued that MEMX can be judged a success in three years time if the exchange has “meaningful” market share so members’ voices are heard.
“We are competing in 45% of the market so success varies between 5% and a double digit share,” he added. “It is likely to be in the middle of the range and we do not have a time horizon. We are currently just trying to get to the end of the week.”
Exchange revenues
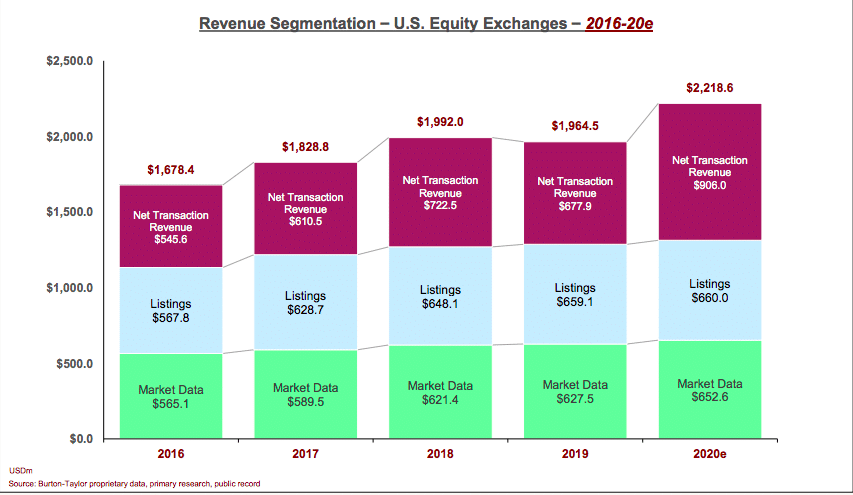
US exchanges are expected to have record equity-related revenues of $2.2bn (€1.9bn) this year, up 12.9% from 2019, according to new research by Burton-Taylor International Consulting, part of TP ICAP’s data & analytics division.
The study said net transaction fee revenues are projected to total $906m in 2020, an increase of 33.6% from 2019.
US equity exchange market data revenues from proprietary products and SIP shared tape revenues are projected to be 4% higher at $652.6m.
Andy Nybo, managing director at Burton-Taylor, said in a statement that the entrance of three new exchanges into the already crowded marketplace will have significant impacts on market structure and exchange economics.
“Although incumbent exchanges are well-positioned to fend off competitive threats posed by these new entrants, the new exchanges will have a considerable impact on equity market structure resulting in shifting market shares, greater structural complexity, and changes in industry governance practices,” he added.

MIAX PEARL Equities has started trading test symbols after Members Exchange launched last week as the fifteenth US equity exchange.
Last week MIAX PEARL Equities said it has begun trading in all NMS test symbols and will launch its first symbol on September 29. The exchange will roll out additional symbols from October 2.
Today, trading began in all NMS test symbols on MIAX PEARL Equities, our first equities exchange. We are excited for MIAX PEARL Equities to officially go live and to bring innovation, choice and competition to the equities marketplace. https://t.co/5PtWzO2uJz
— MIAX Exchange Group (@MIAXexchange) September 25, 2020
The exchange is owned by Miami International Holdings, who already operate three options exchanges as part of the MIAX Exchange Group.
Thomas Gallagher, chairman and chief executive of MIH, said in a statement: “Through the outstanding work we’ve done at our options exchanges and our demonstrated ability to manage complex trading initiatives, we’ve established a level of confidence with the trading community that constitutes the bedrock for the success we anticipate in MIAX PEARL Equities.”
The MIAX equities platform will supplement its existing three US equity options exchanges which have had significant market share gains this year according to a new report from Burton-Taylor International Consulting, part of TP ICAP’s data & analytics division.
“Burton-Taylor expects MIAX PEARL Equities to become successful, with market share expected to build over time,” added the report. “MIAX does face challenges competing against 14 established equity exchanges many of which operate multiple market models, as well as the launch of MEMX which has broad support from its founding members.”
MIAX is using an equity rights program an an incentive to participate in the new exchange and participants include Citadel Securities, Hudson River Trading, Jump Trading Group, Simplex Trading, Susquehanna Securities, and UBS.
Industry-leading firms such as UBS and Citadel Securities will begin trading equities on MIAX PEARL beginning September 25. Learn more about how we’re bringing performance, transparency and risk management to the equities marketplace. https://t.co/6X5bz93NrP
— MIAX Exchange Group (@MIAXexchange) September 14, 2020
“The MIAX ERP members represent some of the largest participants in U.S. equity markets with access to retail order flow from fintech brokers like Robinhood, WeBull and Public,” added Burton Taylor.
Participants in the program have the right to invest in MIH in exchange for the prepayment of certain exchange fees and meeting certain liquidity volume thresholds on the new exchange.
“If all participants fully perform over the duration of this equity rights program, MIAX PEARL Equities’ market share from these participants would be 5.5% of average daily volume,” said MIH.
MEMX
Jonathan Kellner, chief executive of Members Exchange, said in a blog that MEMX traded more than one million shares in seven symbols from 31 different members in its first week.
After almost one week of trading, we have executed over one million shares between 31 of our members, with activity increasing each day. Our blog has an update on the week and includes our latest rollout plans:https://t.co/5TAJ3wTkaU pic.twitter.com/KtkiPh929U
— MEMX (@memxtrading) September 26, 2020
Kellner said the exchange is changing its timeline for rolling out more symbols and 12 will now be added on 29 September in order to optimize performance and ensure members are experiencing the technology in the way it was designed.
“From there we will take a methodical approach to rolling out more names with the goal of being live in all NMS names in October,” he wrote. “We want to maintain flexibility to adjust both timing and additional listed names as we go.”
Burton-Taylor said in the report that MEMX is expected to see immediate success, almost entirely on the strength of its founding members, especially Citadel and Virtu Financial, who have clearly announced their intentions to support the exchange with order flow.
”MEMX faces a number of challenges to its success including operational risk associated with launching its first trading platform built from scratch; limited experience in operating an exchange; competing against 14 established exchanges many of which operate multiple market models; and the pending launch of MIAX Pearl Equities with its low cost, technology advanced trading platform,” added the report. “ Its members also have conflicting business models that will need to be managed by MEMX management.”
Equity exchange revenue
The consultancy forecast that total US equity exchange industry revenue will increase 12.9% this year to a record $2.2bn (€1.9bn) due to a surge in trading.
Andy Nybo, managing director at Burton-Taylor, said in a statement: “Although incumbent exchanges are well-positioned to fend off competitive threats posed by these new entrants, the new exchanges will have a considerable impact on equity market structure resulting in shifting market shares, greater structural complexity, and changes in industry governance practices.”


The European Securities and Markets Authority (ESMA) has published draft regulatory and implementing technical standards (RTS and ITS) for third-country firms under MIFID II.
The changes include new reporting requirements for third-country firms to ESMA on an annual basis and the possibility that the EU regulator will ask them to provide data relating to all orders and transactions in the bloc.
The aim is to provide ESMA with information for all trading activity done in the EU by firms outside the EU.
The draft technical standards have been published following the changes to MiFIR and MiFID II regimes for the provision of investment services and activities in the EU by third-country firms, introduced by the Investment Firms Regulation and Directive.
ESMA said the drivers were the ability to “identify any potential circumvention of EU law by third-country entities. The use of the reverse solicitation option by third country entities beyond their regulatory borders is a major concern in this respect.”
In addition, new annual reporting requirements from branches of third-country firms to national competent authorities (NCAs) have been introduced.
 ESMA explained that while branches of third-country firms authorised under MiFID II are supervised by the relevant regulator of the authorising member state, the investment firms directive amends MiFID II to provide for further reporting obligations on such branches to the member state authorities where they are established.
Market participants believe that it will only increase the workload for UK based firms. As Volker Lainer, vice president of product management and regulatory affairs at GoldenSource, put it, “This report reflects the reality of what being a third-country means. Regardless of whether a trade agreement between the EU and the UK is struck, it will not be business as usual when it comes to regulatory reporting from January 2021.”
He called the report a “wakeup call to UK based firms who have not yet got to grips with precisely what needs to be reported on to whom, and when. Only through centralising all their data can firms ensure they’re not just avoiding both non-compliance and costly over-reporting, but also prepare themselves for any future regulatory changes across other third-countries and to reflect divergence created by the FCA.”
Clement Miglietti, chief product officer, NeoXam, added, “If this divergence does occur, then investment managers would need to put two separate systems in place in order to fulfil the different regulatory requirements of the EU and the UK. They will need to have the ability to make changes in their UK market data without affecting their European reporting commitments and vice versa.”

Global Trading is an industry-leading news service for the global equities capital markets: providing information, education, insights and analysis for senior professionals working within trading and execution across Europe, the UK, North America, APAC and other emerging markets. With a focus on the intersection between the buy and sell-sides, Global Trading covers all industry elements from technology and trading strategies to regulation, best execution, market structure and liquidity.
Copyright © 2024 Markets Media Europe Ltd.
We're Enhancing Your Experience with Smart Technology
We've updated our Terms & Conditions and Privacy Policy to introduce AI tools that will personalize your content, improve our market analysis, and deliver more relevant insights.These changes take effect on Aug 25, 2025.
Your data remains protected—we're simply using smart technology to serve you better. [Review Full Terms] |[Review Privacy Policy] By continuing to use our services after Aug 25, 2025, you agree to these updates.

