Home Blog Page 453

Record Demand for Data Due to Covid-19

Volatility caused by the Covid-19 pandemic has led to record data usage according to provider Refinitiv with a 50% increase in mobile usage as staff are forced to work remotely.

Andrea Remyn Stone, Refinitiv

Andrea Remyn Stone, chief customer proposition officer at Refinitiv, told Markets Media: “We have seen record data usage during the pandemic, with some interesting trends in the ‘data on the data’.”

She continued that, for example, there has been an eightfold increase in demand for mortgage data. There has also been more demand for debt data such as leveraged loans, corporate bonds and credit profiles.

“There has been a 20% increase in web usage and 50% on mobile usage,” Remyn Stone added. “Daily messages across our platform have grown to 186 billion a day, compared to 80 billion after the Brexit vote, and between 40 to 50 billion on a normal day and we have not had any outages.”

As the volumes of data usage has risen, customers have needed help in making sense of the information deluge. For example, Refinitiv has overlaid economic data with news, markets data and physical data, such as shipping, in a Covid app. Users can drill down by country, sectors and companies to find opportunities, as well as assess risks.

The volume of digital queries has also increased by 60%. Remyn Stone explained that the buy side has been using REDI and AlphaDesk to trade remotely and sell side compliance issues, such as recording communications, are being solved.

“There is a new generation of users who are digitally savvy and a new working environment is emerging,” said Remyn Stone. “This crisis may be seen as the beginning of the end for the need for large workforces staffing a physical trading floor.”

In addition to wanting more data, there have been unprecedented demands such as central banks wanting to launch money market desks, which Refinitiv completed in three hours. “We have had to move fast to help customers respond to the crisis,” said Remyn Stone.

ESG data

Remyn Stone added that demand for environmental, social and governance data has not slowed down during the pandemic and it has become a “must-have.”

ESG data is one of Refinitiv’s most important strategic priorities, especially for private companies where the information is harder to find.

“We use 160 fields across ten different themes to compile a company’s ESG score and Lipper plans to start giving funds a score later this summer,” she added. “We always provide transparency, opening up the black box so users can see how the ESG score is calculated.”

Lipper provides fund performance data and tools for fund research.

Open platforms

Remyn Stone joined Refinitiv in London in February this year to lead proposition management and product and content development, reporting to chief executive David Craig. Her previous roles include chief strategy officer at Dealogic and global head of strategy and corporate development at Bloomberg.

At Refinitiv she will work with customers to develop offerings in open platform technology collaboration.

“An open platform and framework is essential in institutional financial services so users can move seamlessly between mobile, web and cloud,” said Remyn Stone. “The platform needs to open to third party apps as customers want the same flexibility as they get with Spotify.”

She continued that Refinitiv needs to focus on on delivering data in solutions that are mobile-first and API-first within a consistent framework.

In addition, there are more than 35,000 external developers around the world working with Refinitiv data and they need the data taxonomy to be open. “We have a proactive program to engage with more developers and create an ecosystem,” she said.

Global Spend

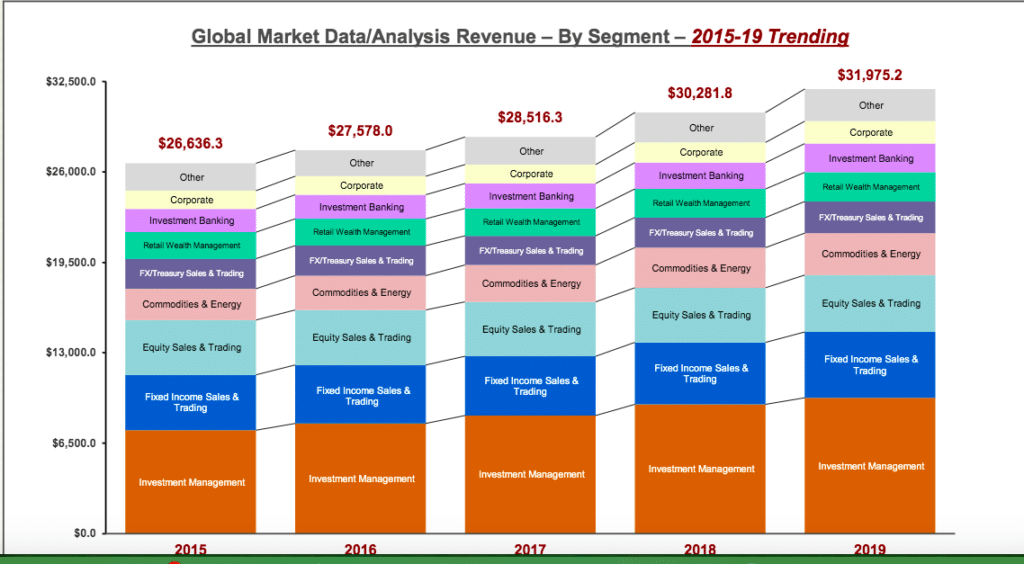
Global spend on financial market data/analysis was $31.9bn (€30bn), an increase of 5.6% from 2018 according to the  Burton-Taylor annual study, Financial Market Data/Analysis Global Share & Segment Sizing 2020.

Global market data/analytics revenues. Source: Burton-Taylor.

“In a world where the influence of Big Data leads capital markets firms to be relentless in their pursuit of correlation and solutions, firms are increasing their budgets for data acquisition and analytics to develop solutions solutions from that data,” added the study.

Investment management is the biggest spender at $9.7bn, nearly one third of the total.

The report noted that the shift of flows from active to passive investment has affected market data usage as spending on traditional equity and fixed income segments has fallen.

However Burton-Taylor also warned that the threats of market data fees and ‘speed bumps’ muzzle some of the opportunities for providers.

In addition, the London Stock Exchange Group has made an offer to buy Refintiv and the transaction is being reviewed by regulators.

“The promise of great business synergies keeps the market data providers opportunistic, as seen by LSEG’s acquisition of Refinitiv,” said the report. “Burton-Taylor sees similar activity as likely in the next 18 months.”

Covid-19 Spurs Innovation

Harpal Sandhu, founder and chief executive of fintech Integral, said financial services firms will now be receptive to how cloud computing can change their business models as the need for remote working has demonstrated the effectiveness of the technology.

Harpal Sandhu, Integral

Sandhu told Markets Media: “There has been a realisation that the cloud is really powerful and firms have had to overcome their inertia. Covid-19 has forced people to make changes in their behaviour which would have taken years.”

For example, Integral has one client who built their IT in-house for decades but then asked how fast they could move to the cloud.

“They found there was a huge opportunity cost when volatility spiked in March as competitors who had already moved to the cloud were immediately able to service clients more efficiently,” Sandhu added.

He continued that financial firms have realised they do not need an expensive IT department to maintain their current footprint and can also increase their flexibility.

After the crisis he expects that, when restrictions on movement are lifted, staff are unlikely to go back to offices in mass. For example, teams could be broken up with staff taking turns to go into the office as cloud computing allows them to work seamlessly between the office and home.

“My biggest prediction is not only that working from home will stay, but additionally staff will be able to work from remote locations where real estate is cheaper,” Sandhu added.

He predicts there will be innovation both internally within firms and externally.

“Everyone is going to dust off their examples of how cloud can fundamentally change businesses and the audience will now be fantastically receptive, added Sandhu. “There will BC and AC eras – before Covid-19 and after Covid-19.

For example, Integral has provided cloud technology in foreign exchange that is delivered through web drivers and allows monitoring of risks in real-time.

TrueFX, a spot trading FX facility for the buy side, is centrally cleared by Jefferies FX prime brokerage. This month the first trades were completed on the platform by FXCM, AxiCorp, Velocity Trade and leading electronic market makers.

Brendan Callan, chief executive of Forex Capital Markets (FXCM) said in a statement: “TrueFX is an exciting and innovative proposition that allows more market participants to connect and trade with the widest range of counterparties. By eliminating credit as a barrier to market, many can access core FX liquidity far more efficiently than ever before.”

Post-trade innovation

James Maxfield, managing director at Ascendant Strategy, a post-trade consultancy in capital markets, said in a blog for ipushpull that the coronavirus crisis could provide a catalyst for change.

For example, leaders have seen the benefit of digital communication with their teams.

“Ascendant Strategy spoke with the client service head in the markets division of a bank who was delighted with how Zoom was able to connect him with his teams,” added Maxwell. “They have now seen what is possible in terms of communication mechanisms such as Symphony, Slack and Microsoft Teams. And they like it.”

He continued that traditional approaches to crisis management, with key people huddled together in a war room, no longer works.

“However, this is already showing itself as being unsustainable during this extended lock down period – anecdotally, fails and collateral management are key pain points within the industry right now – highlighting the lack of standardised processes and pinch-points within many post trade processes that cause them to lack scale in stressed situations,” wrote Maxwell.

As a result, the digitisation of post-trade processes will accelerate.

“The change is already happening with, for example, firms like ipushpull offering real-time workflow apps and notifications and as a service across multiple channels including chat applications,” he said.

Change in gender balance

Consultancy Oliver Wyman said in a blog that the Covid-19 crisis has shown that diversity of thought is crucial as some of most effective responses have come from countries with female leaders -Iceland, Taiwan, Germany, New Zealand, Finland, and Denmark.

“This should underline to financial services companies that diversity in their own COVID-19 response teams is not just nice-to-have, but essential,” said Oliver Wyman. “They must recognise the importance of cultivating a broader range of perspectives and ways of thinking in how they deal with crises.”

The consultancy continued that the crisis has also demonstrated that financial services companies can operate remotely, even in trading. As a result financial services companies can embed flexible working practices to attract more diverse employee.

“The flexibility remote working brings will reduce the need for ambitious employees to make sacrifices in their personal lives in order to reach leadership roles,” added the blog. “Both these outcomes will significantly benefit women and improve the gender balance in financial services.”

Financial Firms ‘Cloudify’

Banking and insurance firms’ business continuity plans had historically involved relocating to a back up facility but the  restrictions on movement due to the Covid-19 pandemic have forced them to “cloudify” their offerings.”

Alex Foster, BT

Alex Foster, director of global insurance, wealth management and  financial services at BT, told Markets Media that the current pandemic has led to a widespread distribution of people and is a whole new ballgame as firms have needed to set up on-line versions of their traditional business while maintaining controls over staff working from home.

“Organisations have had to “cloudify” their offerings,” Foster added.

For example, BT has been able to offer customers a virtual trading turret in the cloud which meets their regulatory and compliance needs.

Consultancy McKinsey said in a blog this month that the Covid-19 crisis is likely to significantly accelerate the shift to digital.

BT is also supporting fintechs who are helping digitise financial services.

“We are accelerating the use of fintech and supporting people and organisations that seek to create new products or services enabling them to use our cloud environment for distribution to thousands of customers,” Foster added.

She continued that the “genie is out of the bottle” on working from home.

“Employees want more flexibility and research has shown that productivity increases when working from home,” she said. “We could see an innovation boom, as people collaborate in different ways, creating a productivity spike.”

Some academic research has shown that working from home can increase performance by 13%.

“The pandemic is an opportunity to show that technology has a positive purpose as digital connectivity is very important to many generations,” she added.

Career history

Foster has a degree in mathematics, statistics and computer science and a qualification in actuarial science but began her career on the trading floor as a salestrader in 1994, voice trading in equities and equity derivatives.

She subsequently had roles as head of execution sales (UK) and market structure at BNP Paribas, where she set up an electronic trading desk, and as head of sales at broker Instinet. Foster has been in her current position since 2018 after joining BT in 2011.

“BT provides tools that allow technology to help markets evolve and when they asked me to join I made a conscious decision on where to spend the next 20 to 30 years, “ Foster said.

She continued that her careers in both investment banking and technology have enabled her undertake multiple types of roles, acquire a variety of skills and helped her grow.

“My advice is, if the opportunities are there, you should not be frightened of grabbing them,” added Foster. “It can be frightening to be a change agent.”

She compared the process to her son’s wakeboarding.

“As the waves go by you always have to be on the leading edge by acquiring new skills and capitalising on the opportunity to grow,” she said. “To have the edge in life you have to learn and earn for yourself, for your business and you also have to have fun.”

Diversity

Foster acknowledged that both finance and technology could use more women.

“There were very few women when I worked on the trading floor and there have been improvements, but other industries have done better,” she added.

She continued that BT is working very hard top increase diversity through its TechWomen program and teaching digital skills in schools.

“Half of our graduate intake is female and we work very hard in equipping women with the skills to succeed,” she said.

As a result, BT has a very high rate of returners to work after maternity leave at more than over 85% according to Foster. She added: “The firm makes working from home and managing staff fairly easy and this flexibility helps parents.”

However, digital skills begin at home so BT has been advancing programmes in the UK, as well as internationally, which Foster said are to encourage lateral thinking and key skills development that will be needed in the future.

Demand for Green Bonds Exceeds Vanilla Equivalents

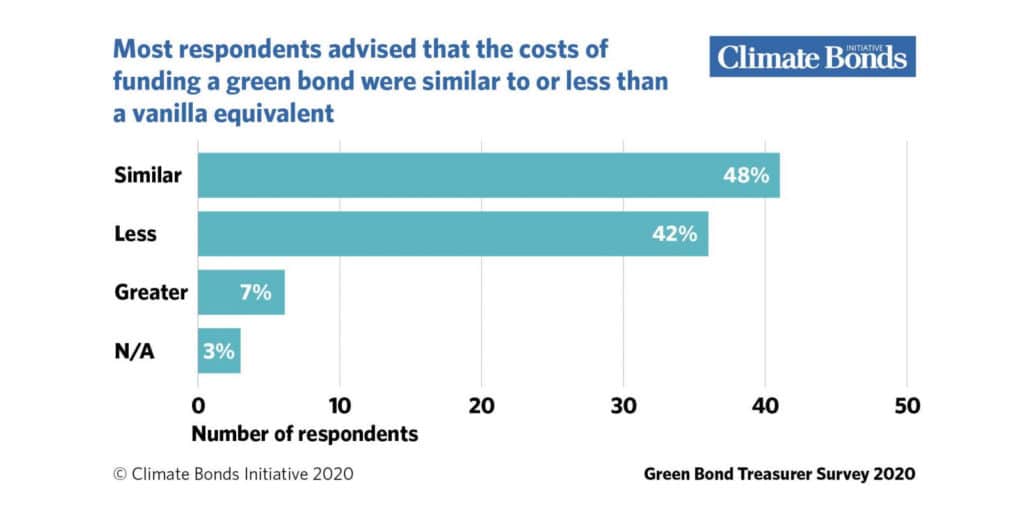
Demand for green bonds is higher than for their vanilla equivalents while the cost of funding is the same or lower according to a survey from the Climate Bonds Initiative.

The non-profit organisation’s first Green Bond Treasurer Survey had 86 respondents from 34 countries representing nearly half,  44%, of the identified green bond universe.

The majority, 70%, of respondents said the demand for their green bonds was higher than for vanilla equivalents while nearly half, 42%, said green bond costs were lower.

Sean Kidney, chief executive of the Climate Bonds Initiative, said in a statement: “The investor appetite is there. It will only increase as asset owners and institutional investor calls grow for climate, resilience measures and sustainability considerations be at the core of stimulus and economic response programs.”

None of the respondents said they they received less interest for a green bond compared to vanilla equivalents.

Cost of green bond funding. Source: CBI.

The study continued that the costs of funding for green bonds were lower than for vanilla bonds for larger issuers, and those with more years in the green bond market – which may be due to spreading the costs of issuance,  incurring economies of scale, and achieving a lower interest rate.

“For example, Berlin Hyp recounted that unique expenses, including the adaptation of IT systems and internal processes, were incorporated into the cost of its first green bond, but the ramifications extended to subsequent issues,” said the survey.

Nearly all respondents said green bonds diversified their investor base and facilitated more engagement compared to a vanilla issue, which benefits future financing and enhances liquidity. For example, a traditional euro issuer sold a green bond in US dollars to new investors, who started buying the vanilla bonds as well.

Investors also interrogated issuers on the use of proceeds, the green bond framework, and post-issuance reporting which gave them more knowledge of the firm.

Kee Chan Sin, treasurer as telecoms firm Verizon, said in the report: “The extra financial costs of issuing a green bond were negligible. It is the effort, not the cost which is the barrier to entry.”

The survey was sponsored by Danske Bank and Luxembourg Stock Exchange with supporting analysis from Henley Business School from the University of Reading.

Green bond performance

NN Investment Partners, the Dutch asset manager, found green bond demand and flows have remained intact during the current Covid-19 pandemic.

Bram Bos, lead portfolio manager green bonds at NN IP, said in a statement that in the current market both traditional and green bonds sell off.

Bram Bos, NN IP

“In the last few weeks, there has not be a significant difference in how green bonds have behaved in comparison to their traditional peers,” he added.

He noted that most managers are holding onto the green bonds in their portfolios and that flows, and demand, are increasing rather than diminishing. In addition, the corporate green bond index has outperformed the traditional corporate index.

“The green bond corporate index does not include airlines or energy companies – those sectors were hit by the compounded effects of the coronavirus and the plummeting oil price,” Bos added.

However the green bond index includes utility companies that he said tend to be better prepared for uncertain times, more forward looking and are often better managed than firms that do not issue green bonds.

“Although it’s still early days to draw any major conclusions, we don’t see interest in green bonds diminishing in terms of our clients, nor are our funds experiencing much outflow,” he added. “We should see a continuation of the growth of the last two years and the effects of the crisis may even give the green bond market an additional boost.”

NN IP also expects the sovereign green bond segment, 17% of the total market, to benefit from the response to the Covid-19 pandemic as governments need to finance their increased spending.

Sustainable equity strategies

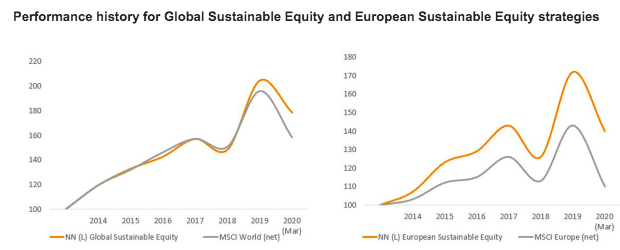
In the equity market, sustainable strategies have also outperformed according to NN IP.

Performance of sustainable equity funds. Source: NN IP.

The Dutch manager said both its global and European sustainable strategies have displayed considerable resilience in the face of the coronavirus. For the year to date, the global variant has beaten its benchmark by 6.5%, while the European strategy has generated relative outperformance of 4.1%.

Hendrik-Jan Boer, head of sustainable and impact equities at NN IP, said in a statement that the team had identified remote working as a growing trend before the crisis began and has only added three names in the past two months.

NN IP  believes that the crisis has intensified investors’ focus on environmental, social and governance factors, with social becoming more prominent, as investors review how companies are supporting their employees.

“It’s now more evident than ever which companies are able to navigate this period of uncertainty without being punished for bad capital allocation or frustrating equity investors by issuing new shares,” added Boer. “This is all determined by their long-term governance approach, and from our perspective, the companies in our portfolios have lived up to our expectations during this crisis.”

Sustainable investing

Schroders, the UK fund manager, said asset owners have continued to demand sustainable/ESG funds in the market downturn.

Katherine Davidson, portfolio manager, global & international equities and Scott MacLennan, fund manager/research analyst, European equities, said in a blog that sustainable investing has grown exponentially. In the US, net flows into sustainable funds reached $20.6bn last year, more than four times the previous annual record in 2018.

“As much as we are sceptical of passive ESG funds, it is interesting to see that the MSCI ESG Leaders indices have outperformed their mainstream counterparts in most geographies, albeit modestly in most instances,” they wrote.

The biggest outperformance has been in the UK where FTSE 100 ESG Leaders index has fallen -27.3% year-to-date compared to -33.7% for the FTSE 100 index. The MSCI ESG Leaders indices target companies that have the highest ESG rated performance in each sector of the parent index.

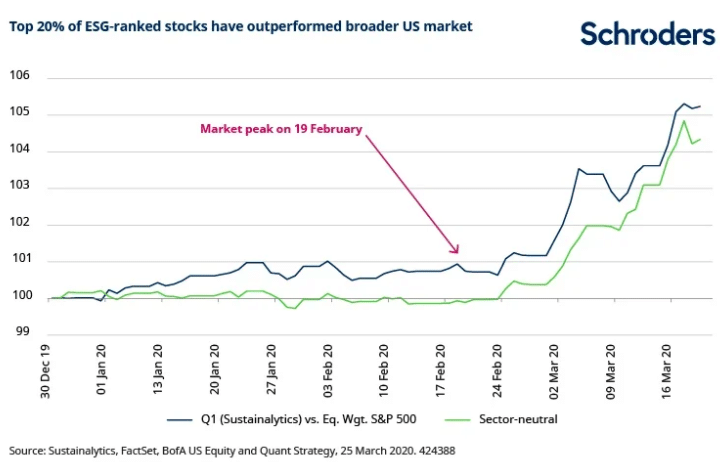
The blog said: “Research by Bank of America Merrill Lynch also finds that the top 20% of ESG-ranked stocks outperformed the US market by over 5% during the recent sell-off. This is partly because ESG leaders have so far seen smaller earnings per share cuts than ESG laggards.”

Top 20% ESG-ranked stocks have outperformed. Source: Schroders.

In addition Schroders said ESG exchange-traded funds have had lower outflows and are still net positive year-to-date compared to record outflows from equities overall.

“Moreover, it seems to us that this crisis has actually increased the visibility and perceived importance of sustainable business practices,” said the blog. “Companies’ treatment of their customers, employees and suppliers is under greater scrutiny than ever before.”

Execution analysis : Order routing : Henry Yegerman & Chris Sparrow

DO YOU KNOW HOW YOUR ORDERS ARE ROUTED?

By Henry Yegerman, Global Head of Sales, and Chris Sparrow, Head of Research, ISS LiquidMetrix

Do you know how your order is routed? Should you care? Lately, more and more emphasis is being placed on how orders are routed. Typically concerns are raised around whether brokers are routing in their own best interest or in their clients’ best interest. Other considerations relate to whether certain trading venues are ‘toxic’ and lead to deterioration of performance.

Let’s begin with a bit of background. In order to realise an investment opportunity, traders must first acquire a position. They can do this by buying or selling shares of stock in the ‘market’. While this sounds quite simple and maybe obvious, the term ‘market’ hides a lot of complexity. The reason is that the ‘market’ consists of many places to trade. While many years ago, there was typically only a single place to trade (often called an exchange), we now have many places to trade, some with names like MTFs, ATSs or ECNs. This means that we need to make choices about which of these venues to interact with when we go to purchase shares of stock. We also need to consider the ways in which we interact with the collection of trading venues we refer to as the ‘market’.

While there are many possible questions to address, three key questions we would like to answer regarding our order are: When did we execute? Where did we execute? and How did we execute?

The portfolio manager generally knows why they want to execute, but the other three questions all relate to how the order was managed by a broker. The brokers use technologies such as algos that determine timing, and routers that determine where to direct the order and the way to execute.

One of the key things being managed in this approach is market impact. When we go to the market, we don’t want to move the market too much as that can only hurt our performance. At the same time, the role of the market is to provide price discovery – the process of finding equilibrium prices that balance supply and demand. Therefore, we want to develop tools that can allow us to determine the answers to the questions of where, when and how we should trade so we can understand why we got the outcome we did.
Ultimately what we want to be able to do is to see the big picture of how our order interacted with the market. It therefore seems natural to visualise this interaction in a picture. We can develop such a picture by plotting the way we interacted along three dimensions.

The first dimension we care about is time – we want to answer the question ‘when did we trade?’ We want to be able to show how much volume we traded as a function of time. The second dimension we care about is the trading venue – we want to answer the question ‘where did we trade?’ The third dimension we care about is the way we interacted with the market – did we cross the spread and remove liquidity? did we post our order passively in the book providing liquidity? or did we execute in a dark pool? – we want to answer the question ‘how did we trade?’

Unfortunately, pictures are two dimensional, so how can we show these three dimensions in a single picture? Well, fortunately, there are colour pictures! So maybe we can answer all three questions by developing a colour image. We can show a time dimension along the horizontal dimension of our picture, and a venue dimension along the vertical dimension of our picture and then the colour can indicate how we traded.

We use the property that any colour is a mixture of red, green and blue. So, if we use red to represent the ‘active’ volume from crossing the spread, blue to represent the ‘passive’ volume and green to represent dark volume, then we can combine three ways of interacting with a venue into a colour which is itself a mixture of active, passive and dark volume. The intensity of the colour is proportional to the amount of volume while the actual colour is determined by the distribution of active/passive/dark. When the pixel is red, it means the volume in that bucket was all active. If the pixel is blue, the volume was all passive, while if green, then the volume was all dark. Other colours are mixtures of these three ‘primary’ colours.

This has real-life applications in evaluating the order routing of different brokers and can be used as an input into making Algo wheel strategies. Analysing execution data in this way allows us to clearly see the differences in order routing between brokers both under similar and different trading conditions. How differently do different algos trade? How similar are different brokers’ algos? How does my trading strategy influence my realised market impact?


Consider the differences between the routing in Figures 1 and 2. These 2 images both show a single order in AMD done withing 6 weeks of each other. The x-axis represents the time of day, and in this example shows 30-minute time buckets between the open and close of the market (9:30 – 16:00). Each row shows a different trading venue. The colour shows the way the order was traded by combing active, passive and dark fraction of volume as an RGB triplet, while the brightness represents the fraction of the overall order done at the given time on the given venue.

We can see that Broker A mixes both aggressive and passive executions across multiple venues while Broker B largely executes on a single venue throughout most of the trading day.

This technique can easily be used across an aggregate of thousands of orders to identify the broker’s order routing tendencies.


In Figure 3 (low volatility), Broker B relies heavily on a single trading venue and is largely passive in execution style. However, in a high volatility environment, order routing switches to using many venues and becomes somewhat more aggressive.

The use of color allows us to clearly see differences in venue selection, timing and the degree of active versus passive trading. More importantly, the colors, brightness and size of each box can be converted into numerical equivalents which allow us to quantify the differences for best execution and specific applications such as Algo Wheel selection.

©BestExecution 2020
[divider_to_top]

Complaint to EU finds GDPR at risk of failing due to underfunding

The General Data Protection Regulation (GDPR), the European Union’s digital privacy regulations introduced in Europe nearly two years ago, is in danger of failing because regulators have not been properly resourced, according to a complaint filed with the European Commission against all 27 member states by privacy focused web browser Brave

In the filing, Brave said that governments across Europe have failed to give data protection agencies “the human and financial resources necessary to perform their tasks.”

Dr Johnny Ryan, chief policy officer, Brave

Dr Johnny Ryan, chief policy officer at Brave noted, “If the GDPR is at risk of failing, the fault lies with national governments, not with the data protection authorities.” The claim is that half of Europe’s data protection authorities have an annual budget under €5 m and that just five national regulators currently employ more than 10 investigators.

Ryan said that the number of technical specialists on the staff of regulators across Europe varied significantly. Studies show that Germany was out in front with 101 specialists at its data regulators and this accounted for roughly 13% of the total headcount. The UK’s Information Commissioner’s Office was in fourth place with 22 or just over 3% of its total staffing while Spain and France both had more specialists, despite their regulators being less than a third the size of the UK’s by number of staff.

Under the GDPR, any organisation using and storing EU customer data is responsible and accountable for the storage and processing of it. Failure to comply can result in fines of up to 4% of global revenue or €20m, depending on which is higher. The rules served as a model for new privacy rules in Brazil, Japan, India and elsewhere.

Breaches of data have also come under intense scrutiny due to COVID-19 and the ensuing lockdown environment whereby significant numbers of people are working from home.

The GDPR posed specific challenges for the financial sector because of the vast quantity and types of data within their organisations which are considered high value for hackers. They had to invest in staff and new technology which were both expensive and time consuming. Implementation costs for UK banks alone, ran to an average of £66m, the highest spend of any industry sector, according to consulting firm Sia Partners.

Regulators have acknowledged the problem in a February survey of privacy regulators in 30 European countries to the European Data Protection Board. It found that 21 believed “resources were not enough” to fulfil their responsibilities.

©BestExecution 2020
[divider_to_top]

Me The Money Show Episode 3

Dan Barnes interviews Lynn Strongin Dodds on the latest issue of Best Execution.

Analysis : Equity markets in Europe : Spring 2020

LiquidMetrix analyses consolidated performance figures for equities and ETFs traded in Europe in the previous quarter.

LiquidMetrix’s unique benchmarking methodology provides accurate measurements of trends in market movements. We have seen many changes to market microstructure over the last year, and here we present statistics from January 2019 to March 2020 as a guide on the current trend.

To give an overall indication of the market from the beginning of 2019 to the end of Q1 2020, we are comparing the value traded in Europe against the % traded LIS. The trend over the year was a steady increase in the % LIS against the general increase in value traded to its peak in June, although slightly declined in the last two quarters of 2019 and remained at a consistent level. In Q1 2020 we see the dramatic increases in volumes, but the % LIS declines in early March, then increases significantly.

One criteria to assess venue quality is the % of times the venue has a best price in the market. This is a measure of how competitive the lit markets are as it is based upon the major index constituents of each market, and includes both price ties and unique best price. There was very much a change in direction for lit markets in Q1 as the trend was largely reversed from Q4 2019.The primary venues all had decreases in % time best price across all markets. There was a dramatic decrease on CHIX across all markets, the reduction being mostly more than twice any other venue decrease. Turquoise gained a little on FTSE possibly indicating more resilient price making participants.

The market liquidity picture shown below reflects only the first two months up to the beginning of March and does not display the effects of the pandemic on the dramatic reductions in liquidity later in the month. Liquidity over the first two months of 2020 was in fact increasing on most markets.

The tables above provide a method to asses performance of dark pools in Europe with the value traded, average trade value and measure the % of times there is a corresponding movement on the lit market. Overall, there was an increase in trade sizes across all dark markets in the period and Turquoise increasing its ranking on MIB now ranking first on all markets. Liquidnet also moved up the rankings on MIB.

For the periodic auction pools, Turquoise gained a place on FTSE, and Sigma Y rose to rank second on DAX as it is on all other markets.

As has been previously noted in 2019 we had seen an increase in trade sizes across the non-lit regulated markets, but we see some dramatic changes in volumes traded in SI.

The chart above shows the trend in daily value traded in dark pools, periodic auction venues and SI for major index constituents across Europe from Q4 2019 to Q1 2020.

We can see from the chart that the trend in dark value traded increased towards the end of Q4, but had the reductions expected towards the end of year. In Q1 dark volumes increased again, but periodic auction volumes remained
flat, but conversely there was a dramatic increase in SI volumes back up to the rates seen prior to year-end. The SI volume has remained reasonably consistent throughout Q1 with a few spikes at the large volatility days.

ISS LiquidMetrix are pioneers in the measurement of European Fragmented markets, and provide research,TCA best execution and Surveillance for financial market participants and regulators – www.liquidmetrix.com

©BestExecution 2020

[divider_to_top]


Equities trading focus : Profile : Vernita Exum : Vanguard Asset Management

Vernita Exum, head of index equities in Europe at Vanguard Asset Management explains how the firm is navigating the current environment as well as the regulatory and technological landscapes.

What measures is Vanguard taking in response to the coronavirus and the current market environment?

To ensure Vanguard can continue operations during a significant regional or global event (such as a pandemic), we routinely perform many of our mission-critical business functions in more than one location. This practice provides geographic diversity for our operations and helps ensure our most critical resources and employees are available to clients during an emergency.

Complementing our multiple campus locations in the US, we also leverage Vanguard locations outside the US to provide additional layers of operational options, and to facilitate a 32-hour trading day. Our global locations are leveraged to transfer trading between regions as necessary.

Furthermore, our Business Continuity Teams have worked across the company to ensure that teams can work remotely when needed. Our investment teams regularly practice contingency scenarios including alternate work locations. And the global nature of our investment teams ensure that our investment professionals regularly work together across regions to manage our portfolios.

MiFID is two years old and how has it impacted the equity world?

One of the main goals of MiFID II was to increase trading on lit venues, but this has not yet been achieved. In fact, figures show that continuous trading on traditional exchanges accounted for around 36% of all equities trades in Europe last year, down from about 42% in 2018. We have seen a shift in liquidity to systematic internalisers (SI) as well as closing and periodic auctions. We have also seen changes in research coverage under MiFID II in that there seems to be less research being conducted on small to mid-cap stocks. This potentially impacts all investors by creating mispricings in the market which in turn results in the possibility of higher trading costs.

What issues do you see the MiFID refit addressing?

As an industry we have learnt to live with a certain amount of imperfection and tend to be experts at workarounds. We are also expected to deal with constant change, but too much change, too fast, and too often can be majorly disruptive – it is expensive, increases complexity and risk, and distracts from our purpose of focusing on achieving good results for our investors. From a broader standpoint, I think we all hope the refit will result in a reasonable amount of stability. Cost benefit needs to be carefully weighed and time needs to be given for safe and proper implementation for each consequential change.


We would like to see a focus on MiFID II’s Share Trading Obligation. The STO puts restrictions around venue access (it requires trades to be executed only on regulated markets, MTFs or systematic internalisers) which can potentially lower available liquidity and increase market fragmentation. We also are supportive of the prospect of a true EU consolidated tape since this could improve trade execution if it provides a comprehensive, trusted benchmark to monitor transaction cost analysis. Finally, we think there is more work to be done around the reference price waivers associated with crossing stock, and usage of continuous auctions.

What other regulation do you think is having a dramatic impact?

I would say that the CSDR (Central Securities Depositories Regulation) could have a bigger than anticipated impact (see p.78). The regulation, whose implementation has been delayed until 1 February 2021, aims to strengthen settlement discipline by imposing daily financial penalties for failed settlements and mandatory buy-in provisions. Although we support the regulation’s objective of improving the settlement processes of stocks in Europe, we have some concerns that the aggressive buy-in regime could be challenging to manage and result in additional costs that will be borne by end investors.

There is also the potentially unintended consequence of the regulation making it more difficult to short stocks so that cross-border trading strategies and hedge derivative trades will be more challenging to implement. As a result, although not immediately obvious, the CSDR could have a negative impact on the ETF primary market. There remain a number of open questions associated with the implementation of this initiative and I hope that regulators and the industry can use the extended implementation period to address and resolve them.

In terms of industry trends, do you see the migration towards passive investing continuing?

Passive investing has been a long-term trend and I expect it will continue because index-tracking strategies are a cost effective, transparent and easy to understand way to build a portfolio that aligns with an investor’s goals. If you think about a customised portfolio, index-tracking products can be seen as building blocks that offer inexpensive, broad and diversified exposure to markets.

Looking at the future of equity trading – how has sourcing liquidity and volumes changed? How is the industry addressing these changes?

All things being equal, I would generally prefer to source liquidity in one large block than to chip away at an order in an algo for several weeks, so I would say one key change has been the increasing fragmentation of our markets and liquidity pools. The industry has found it more complex and challenging to source liquidity across different venues in an efficient and cost effective manner. Some of this change has been driven by innovation, automation, regulation, as well as competitive forces and these are likely to be the same inputs that will resolve our current challenges. As the investment community targets this opportunity both the buyside and sellside continue to evolve innovative tools and enhance existing tools that can be used to maximise liquidity opportunities. Promising algorithmic trading enhancements, automated trading flow aggregators, and preliminary testing of AI related applications are exciting, but there remains much work to do for the industry and policymakers.

The quality of data is and will continue to be a hot topic. Is progress being made and what needs to be done to continue to improve the quality?

Though there is a long way to go, there has been progress in improving data quality, mostly because there is a big push from trading desks to leverage data for better decision making. We are not only better at tagging, collecting, and storing our internal data, but we also understand that ‘fit for purpose’ does not necessarily mean 100% perfect. There is a much better understanding by everyone involved – portfolio managers and traders – surrounding what questions can be answered by data and the focus is on how we can best use data sources to produce better outcomes for our clients. Of key importance is an industry-consistent approach in how we collect, store and utilise data that is shared between firms, exchanges, and regulators, etc. Industry-wide initiatives continue to try to tackle this (most recently the consolidated tape initiative). It is important that we continue to push forward on solutions for industry wide standardisation.

How is data science being leveraged by your department?

There is no doubt that the industry has adopted a more information performance driven approach and this is also true for our desk. In general, in the past we were more interested in historical data to look at patterns and trends, however as technology has continued to evolve we have shifted to focusing on more dynamic tools. Previously, buyside firms would rely on sellside firms or vendors for transaction cost analysis and other data analysis, but we have now integrated data analytics into our desk workflow, providing portfolio managers and traders with the real-time tools necessary to make data-driven decisions.


It is also a much more collaborative effort, as we have a data analyst on the desk who works alongside our team to analyse strategies, manage the algo wheels and evaluate the trade performance of everyone on the desk, as well as our broker trading partners.

What are some of the challenges with the new technology?

Technology can be a beautiful enabler or an endless distractor. It is very important that we control the tools rather than the tools controlling us. This means understanding our strategic objective and the problem we look to solve, then choosing the right tools that will be the most effective fit for our desk.

It is also key to have a consistent approach to problem-solving to ensure all of my team feel empowered to contribute so that the best ideas are surfaced and heard. If there are benefits to internal development of a new tool, we will carefully consider that route versus an ‘off-the-shelf’ solution.

We believe it is important to continue to invest in R&D, not only to produce innovative ideas and solutions but also in terms of creating a more agile way of working which can produce results much more quickly.

How has your department and industry responded in general to the different regulatory and market trends?

Strategically Vanguard strives to be a leading influencer in the industry and we spend our time working with regulators, index providers, and industry groups to provide ideas, input and guidance. We may work with an index provider, for example, before they implement a particular country in an index to look at the regulation, execution and settlement practice to ensure the market is investable.

If we have concerns, we will help with actionable recommendations for improvements and provide regular feedback. Overall, it is about taking an interest, sharing best practices, and producing successful outcomes for all investors.

I see you were scheduled to be on a panel at TradeTech – do you think progress is being made on the D&I front? How can the buyside build the teams of the future?

I have been in the financial services industry for my whole career in differing roles, and right now the momentum is strong and there is greater awareness that increasing diversity and inclusion is not only the right thing to do but it also has a material impact on the bottom line.

We have to think out of the box such as hiring people from a non-traditional background because they have strong growth mind-sets that will provide us with new opportunities and ideas – we value the ability of these individuals to both learn the business and teach us new things. Also, we have to change how we think about work and how we define productivity (no more office face-time) and create the best overall environment for both business and personal success.

Progress is being made but we have to also recognise that it will still be hard to make big changes, change the status quo and create the optimum workplace of the future. We are very interdependent in the investments and trading community, so firms are rightfully hesitant to take bold steps alone for fear of disruption.

We have recently seen market leaders take brave bold steps such as the London Stock Exchange’s recently published consultation on shortening its trading hours. Steps like this will create better work life integration for all markets related professionals.


Biography: Vernita Exum, is the head of index equities in Europe at Vanguard Asset Management. Exum was previously a portfolio manager in the Vanguard Equity Index Group involved in the daily trading and portfolio management of Vanguard’s international index funds. Before joining Vanguard, she was an equity market specialist for Bloomberg LP and a director on Bank of America Merrill Lynch’s global portfolio trading desk. Exum received an MBA in finance from The Wharton School of the University of Pennsylvania and a BS in accounting from Norfolk State University. She is a CFA charterholder and is a licensed CPA in the Commonwealth of Virginia.


©BestExecution 2020

[divider_to_top]


Market manipulation on the rise

There are growing concerns over remote working and the security threats posed but analysis from London based law firm RPC shows that market manipulation  has been on an upward trajectory with the Financial Conduct Authority reporting 822 incidents last year, up from 666 in 2017 and 812 in 2018.

While the reports to regulators cover a range of asset classes, including bonds, oil, gold and FX, RPC found that 60% related to equities and equity derivatives. The alerts were likely made by brokers, trading houses and fund managers who noticed suspicious movements or order flows being posted by other market participants, according to RPC.

Simon Hart, partner, RPC

“Whilst banks, brokerage firms and other market participants have significantly improved their compliance controls over the years, it is clear that problems remain,” says Simon Hart, partner in RPC’s banking and financial markets dispute team. “However, the very existence of better internal systems and controls may itself be leading to more concerns being identified and reported.”

Hart adds, “It is often in periods of major market turbulence that more serious examples of market manipulation get unearthed. Market manipulation does not need to be on the scale of the LIBOR or FX for there to be a negative economic impact on other innocent market participants. Every distorted market carries a cost for someone.”

Market manipulation is the attempt to artificially increase or decrease the price of an asset, index or its derivative in order to make a gain. Following the LIBOR scandal in 2012, which saw significant fines being imposed on several investment banks, regulators tightened the rules and new benchmarks were introduced to replace LIBOR and SONIA.

However, in 2015, six banks – including HSBC and Barclays – were fined a total of $5.6bn for manipulating the currency market in a high-profile case of market manipulation referred to as the Forex Cartel.

The pandemic and lockdown has only exacerbated fears of market manipulation especially as analysts predict that working from home could become more of the norm as banks and fund managers look to reduce office space and costs.

While it is difficult to predict the new office paradigm, a recent report by Aite – ‘COVID-19: Challenges and Opportunities in Financial Services’, points out that trading-related jobs and institutional procedures and operations may be more challenging to perform at home. This is because it is beneficial for traders to share market colour and information in a live format, especially in asset classes such over the counter securities and fixed income markets that do not trade electronically.

The Aite report also notes that there is typically a higher degree of trade breaks and compliance challenges if functions are somehow excluded or reduced in coverage.

©BestExecution 2020

[divider_to_top]
We're Enhancing Your Experience with Smart Technology

We've updated our Terms & Conditions and Privacy Policy to introduce AI tools that will personalize your content, improve our market analysis, and deliver more relevant insights.These changes take effect on Aug 25, 2025.
Your data remains protected—we're simply using smart technology to serve you better. [Review Full Terms] |[Review Privacy Policy] By continuing to use our services after Aug 25, 2025, you agree to these updates.

Close the CTA