Home Blog Page 495

Esma’s Change Of Share Trading Obligation Not Enough

The European Securities and Markets Authority (ESMA) has revised the scope of its share trading obligation so that all UK shares can be traded in London, but there are still concerns about fragmentation as dual listed shares will have to be traded in the European Union.

In March Esma had announced that after the UK leaves the European Union, EU firms will have to trade certain shares and derivatives on EU or equivalent venues, even if most liquidity is currently in London.

Nausicaa Delfas, FCA

Nausicaa Delfas, executive director of international at the UK Financial Conduct Authority, warned at the time that this would conflict with the UK’s own share trading obligation.

She said: “This has the potential to cause disruption to market participants and issuers of shares based in both the UK and the EU, in terms of access to liquidity and could result in detriment for client best execution. We have therefore urged further dialogue on this issue in order to minimise risks of disruption in the interests of orderly markets.”

As a result Esma said in a statement today the share trading obligation would not be applied to 14 UK shares included in its previous guidance.

https://twitter.com/ESMAComms/status/1133615616986963968

The regulator said the EU share trading obligation will cover all EU 27 shares, i.e. those that have an identification code, ISIN, starting with a country code corresponding to a member state remaining in the EU after Brexit as well as Iceland, Liechtenstein and Norway.

“Esma is doing the maximum possible to minimise disruption and to avoid overlaps, bearing in mind the legal requirements of Article 23 MiFIR,” added the statement. “It would provide a balanced, objective and easily identifiable dividing line between European Economic Area and UK shares.”

The European body said it has held regular discussions with the UK Financial Conduct Authority to try to identify a way forward to avoid conflicting requirements, but at this stage it is unclear what would be the scope of the UK share trading obligation.

The UK Financial Conduct Authority responded in a statement that it was encouraged that Esma has taken steps to reduce the disruption that would be caused by the previously announced scope of the European Union share trading obligation.

https://twitter.com/TheFCA/status/1133616712417468416

“However, applying the EU STO to all shares issued by firms incorporated in the EU (EU ISINs) would still cause disruption to investors, some issuers and other market participants, leading to fragmentation of markets and liquidity in both the EU and UK,” added the UK regulator.

The FCA continued that a number of shares with EU-27 ISINs have both a listing, as well as their main or only significant centre of market liquidity, on UK markets and the change from Esma does not decrease the risk of disruption.

“Absent a determination of equivalence, the FCA will engage with market participants and trading venues about the steps that may be needed to protect the integrity of markets in the UK and to ensure that participants in the UK can continue to achieve high standards of execution for their clients, including when trading EU-27 shares, and that the MiFID II calibrations, which were designed for a pan European market of 28 countries, remain appropriate in a fragmented market,” added the statement.

Christian Voigt, market structure/regulation expert at IONMarkets, said in a blog that while Esma’s new guidance is a step in the right direction, the FCA highlights that even the new approach will cause some disruption.

https://twitter.com/_christianvoigt/status/1133671761587916801

“Whether Esma will change their guidance again remains to be seen, but today’s decision has alleviated some of the fall-out if there is to be a no deal Brexit,” added Voigt. “It would be great if the EU could also take a look at the equivalence decision for trading venues, where a similar problem persists. And once that’s done, we just need to figure out what kind of Brexit we’re going to have.”

Chris Hollands, head of European and North American sales at TradingScreen, said in an email to Markets Media that one of the key drivers for MiFID II was to try to increase transparency across European markets.

“As share trading fragments, one could argue that this defeats ESMA’s policy aim? The only thing market participants can do at this stage is prepare for all possible eventualities,”added Hollands. “Of paramount importance will be ensuring that market practitioners will still be able to execute their orders quickly and securely and to remove any possible trading impediments or inefficiencies in the event of a hard Brexit.”

Simon Lewis, AFME
Simon Lewis, AFME

Simon Lewis, chief executive of the Association for Financial Markets in Europe, said in a statement that the trade body welcomed the statements issued today.

“However, we remain concerned that, in the absence of reciprocal equivalence, EU investors may still not be able to access the major pools of liquidity of a substantial number of EU27 shares and therefore may not be able to execute trades at the best available prices,” added Lewis. “AFME therefore urges EU27 and UK authorities to continue to work together to address this important issue.”

Uncleared Derivative Volumes Hold Steady

The notional outstanding of uncleared interest rate derivatives was $105 (€94) trillion at the end last year, similar to 2016, according to derivatives analytics provider Clarus Financial Technology.

Chris Barnes said on the Clarus blog: “This has been remarkably stable since 2016, in a range of $98 – $114 trillion. Some readers may be thinking how is this possible? If we have clearing mandates across the major jurisdictions, who is still trading uncleared derivatives?”

https://twitter.com/clarusft/status/1131128894717870081

He explained that much of the current notional outstanding reflects new activity, especially swaptions, with monthly volumes of more than $1 trillion each month just in the US, none of which is cleared. In addition, some significant market participants are exempt from regulatory clearing mandates.

“The net balance is to see a relatively stable stock of uncleared interest rate derivatives,” Barnes added. “Compression is not as effective in uncleared space due to credit support annex -specificity, and with the nature of participants more likely to be directional, it looks like this stock of trades is there to stay.”

Barnes was surprised that uncleared foreign exchange derivatives volume of $88 trillion at the end of last year was less than uncleared interest rate derivatives

“Without any clearing mandates in foreign exchange, and non-deliverable forwards only a small portion of the overall FX market, most of the open interest in FX markets is uncleared,” he wrote.

However, Clarus highlighted a sustained reduction in notional outstanding of uncleared credit derivatives from $7.9 trillion to $3.9 trillion in the last three years. Barnes said this probably due to the concentration of trading in index products, which are nearly all cleared in the US due to regulatory mandates.

BIS

The Bank for International Settlement this month released its over-the-counter derivatives statistics for the end of last year.

https://twitter.com/BIS_org/status/1123886078396698624

“Central clearing had been making steady inroads in the OTC derivatives market for many years,” added BIS. “In the last few years, the upward trend has levelled off.”

The study said the share of notional amounts of interest rate derivatives with CCPs has been stable at almost 75% since the end of June 2015. In contrast  only 3% of OTC foreign exchange contracts were with a CCP, while the share for equity-linked contracts was negligible.

BIS continued that the rise of central clearing has been an important structural change in OTC derivatives markets over the past decade, together with an increase in trade compression, the elimination of economically redundant derivatives positions, both of which primarily affected interest rate contracts and drive down their market values.

“New practices such as settle-to-market – where banks, instead of posting collateral against the change in market value (ie variation margin), make outright payments to restore the market value to zero – have additionally contributed to the observed decline in their market values,” added BIS.

However BIS noted that market values for foreign exchange contracts have been less affected by these developments, as only the non-deliverable forwards segment is cleared.

“These patterns help illuminate the decline in market values relative to notional amounts for interest rate contracts, and the relative increase in the gross market value share of foreign exchange contracts,” said BIS.

CCP best practices

CCP12, the global association of central counterparties, today published a best practices position paper to contribute to ongoing discussions around clearing houses’ operations and risk management.

Kausick Saha, chief risk officer at the Clearing Corporation of India and clearing and co-chair of the risk working committee of CCP12, said in a statement: “With this position paper, CCP12 would like to emphasize the important role of CCPs in the financial market and to communicate with the broader industry the current CCP best practices.”

The position paper says policy makers must continue to support the use of global CCP clearing services due to the systemic risk benefits inherent to central clearing, and should everything in their power to avoid taking steps that could undermine the benefits that market users received from central clearing organizations.

Exchange Q&A: Nasdaq

Nasdaq won Best Exchange Group at the 2019 Markets Choice Awards.

Markets Media caught up with Nelson Griggs, President of Nasdaq Stock Exchange, to learn more.

What were Nasdaq’s main achievements/milestones in 2018?

Nelson Griggs, Nasdaq

Nasdaq brought in net revenues of $2.5 billion in 2018, an increase of 5% compared to 2017, resulting from strong organic growth across all of the company’s business segments. Nasdaq expanded its information and technology services businesses, acquiring leading alternative data provider Quandl and financial technology provider Cinnober. The Nasdaq Stock Market also welcomed 186 initial public offerings and 20 exchange transfers to its U.S. exchange in 2018. Seven of the largest 10 technology IPOs, measured by proceeds raised, chose to list on Nasdaq and have been performing well despite market volatility during the second half of 2018. We expect a robust new listings pipeline for the rest of 2019, particularly in the technology and healthcare sectors.

How does Nasdaq differentiate itself from other exchanges?
Nasdaq is relentlessly focused on its clients. Our investment in technology and information services allow us to align our capabilities with client’s priorities. We are proud to create a milestone moment on their IPO day that is unique for our listed companies, more importantly, we are committed to supporting them every single day as public companies. After going public, companies continue to raise capital and focus on meaningful interaction with investors to maximize their valuation. Our full suite of investor relations analytics tools and a board and governance communications solution help management teams to efficiently plan their strategy and tell their investor story. Nasdaq also has a thriving index business for our listed companies to gain exposure to passive investors, which includes the global benchmark Nasdaq 100 with more than $70 billion in assets under management.

What are Nasdaq customers’ main challenges and how are you helping solve them?

Nasdaq representatives accept the award.

Nasdaq customers’ main challenges are accessing the most safe and secure technology, data, and trading platforms to execute on their strategies. We help them inform and engage with their investors through intelligence and communications tools, technology and advisory services through our Corporate Services business unit. As companies staying private longer, Nasdaq Private Market has established itself as a leading provider of secondary solutions for private companies. Since its inception in 2013, NPM has facilitated 240 transactions for private companies, facilitating $19 billion in transaction value, and supporting 24,000 shareholders. These numbers demonstrate our long-term commitment in technology solutions that will best position us as the leading exchange partner supporting companies throughout their corporate journey.

What are Nasdaq’s main current/future initiatives to keep it in the forefront of the industry?
We recently launched TotalMarkets: Blueprint for a Better Tomorrow, which proposes structural changes to the U.S. equity markets to modernize regulations that benefits all investors and issuers. The proposal calls for updating regulations to reflect the evolution of the markets and technology advances that have occurred in the years since major market structure reform was enacted, and for enabling greater issuer choice in how issuers and investors interact within capital markets. Additionally, we continue to see adoption of the Nasdaq Financial Framework, Nasdaq’s harmonized approach to delivering robust end-to-end solutions to financial infrastructure providers globally in an open, agile environment.

Digital Transformation: Assessing Sellside Digital Maturity

Digital Transformation: Assessing Sellside Digital Maturity

This report assesses the digital maturity of commercial and investment banks through the the use of GreySpark’s Delta-X methodology. Scores for 15 Tier I and Tier II CIBs across the five fundamental pillars of digital investment banking support provide insight into the overall status of digital maturity in the industry as well as more specific, granular assessments.

https://greyspark.com/report/digital-transformation-assessing-sellside-digital-maturity/


Optimising The Application Of Toolsets Across Markets

Stuart Baden Powell, Macquarie (Hong Kong)

By Stuart Baden Powell, Head of Asian Electronic Execution, Macquarie (Hong Kong), Dan Royal, Global Head of Equity Trading, Janus Henderson (US) and Hugh Spencer, Head of Asian Trading, Janus Henderson (Singapore)

Buy-side and sell-side senior traders discuss the viability of implementing a global trading model that can accommodate regional differences and idiosyncrasies.

Stuart Baden Powell, Macquarie (Hong Kong)
Stuart Baden Powell (SBP):
Several clients have taken the route of installing an algo wheel or another form of bracketing system. Some have done this in response to markets in financial instruments directive (MiFID) II, to enhance workflow, or to improve execution performance amid a tilt towards a more quantitatively driven buyside dealing desk.

The reasons vary, but implementation variance across clients is wider still. Some have mature processes in place, others are at a nascent stage. In either case — as with the algos that are mapped to each bracket — they share the need for constant refinement and rigorous data analysis.

Globally, much has been made of the challenges of implementing such structures in Asia Pacific (Apac) markets compared with those in Europe, Middle East and Africa (Emea) or the US. Asia traders would point to the nuances of stocks, foreign exchange and regulations versus Emea or the US. Much like Apac though, clients in Emea also face differing exchange operations, still have foreign exchange concerns and specific regulatory challenges. In addition, they encounter far tougher routing logic based on the existence of multilateral trading facilities (MTFs) (both lit and dark), LIS venues or systematic internalisers (SIs) In both cases, clients often trade algorithmically across the full spectrum of countries in their regions.

Similarly, in the US, while foreign exchange and macro legislation concerns fade, further order types, higher diversity of participant strategies and routing requirements are constant challenges to effective automated trading processes.

In all three regions there are unique challenges that can be structured and thus processed and canned into brackets or other automated sequencing. Ultimately there are methods to trade efficiently and effectively on a broadly globally consistent format while adjusting for differences between each constituent stocks’ individual characteristics.

At the entry level, the ability to provide clear, consistent goal-posts and solid levels of communication, coupled with the ability to allow broker discretion to provide optimal solutions to reach those targets, improves relative outperformance.

Janus Henderson runs a broadly globally consistent model, so Dan, how do you see the upsides and challenges cross-region?

Dan Royal, Janus Henderson (US)
Dan Royal:
The use of the term algo wheel has now finally reached a point that it could be considered disingenuous and irrelevant. Automation or augmentation among tool selection is definitely prevalent within most broker, fintech and execution management systems (EMS) offerings. Yet the commonly used term of “wheel” seems to sell short the idea of what we are trying to accomplish.

Wheel has the connotation that the tools are commoditised, performance distinctions are negligible, and selection is based on factors other than performance.

Let’s define what we’re attempting to accomplish: an ability to navigate a complex environment in a dynamic manner that allows us to maximize our ability to access suitable liquidity, minimize adverse impact and do so in a manner that avoids predictability and signaling to potentially predatory participants.

To achieve this, a trader needs a defined and distinct set of tools that can cover the wide variety of market conditions and liquidity demands. Those distinct toolsets need to be well understood, effective in performing their defined tasks, complimentary to the adjacent tool sets and seamless in an ability to navigate among them.

Each toolset needs optimization by continually comparing and contrasting performance among like-minded products. This achieves the framework for a platform of best-of-breed tools that allow the trader or intelligence engine to select the proper tool to navigate almost any scenario. In this case, the spokes represented by the tool sets are unique and distinct, making the wheel significantly out of alignment.
The challenge then becomes the best way to optimize the scope and sequence of tools in any given trading scenario, on the assumption the liquidity need is such it requires a plan and potential course correction. In a truly automated world, the scope of variabilities is massive and the ability to program the decision tree is challenging at best and likely introduces significant gaps in the assumptions.
As the industry pushes towards disintermediation of the human, the value added by the trader becomes underrepresented in the equation. It’s not to say automation and tool switching aren’t relevant, but more to suggest that trader augmentation with the proper toolset and guidance may yield a better outcome.

Lastly, toolsets will and should vary by a firm’s needs or regional distinctions. Even in the confines of our global bracketed algo construct, the regional distinctions between product and market structure requirements are significant. Global efforts should be considered guideposts for the philosophy and framework for the platform. We feel it is important to establish regional product that is optimized to the region’s needs.

SBP:
The point about distinct tools and the need to understand them is key, with an inherent risk in both areas. For example, if you use an average daily volume (ADV) selector as your filter, how do you optimally calculate the level and dynamically adjust? Or do you stretch the targets and move into classification and clustering models? On the latter, which is very topical, we see challenges in implementation, for instance on compactness – that is, within the cluster — or isolation – that is, the distance between clusters. Trading based on specific parameters and algorithms is essential to monitor at the stock level and for an ongoing basis, which is a resource unto itself.

This brings us to chronology, namely: are the costs of implementing and supporting structures (people and analytics) in your favour compared with the benchmark savings you make by potentially static or constrained algo mappings that may or may not produce optimal results – for example, on small ADV and low notional savings? How does this change over time on a marginal cost per basis points saving for example?

The structures of both buy-side and sell-side can also start to adjust — both in skill set transition of existing staff to an actual new breed of staffing. Is the requirement to manually handle high numbers of often binary or “quick to find” answers on sell- and buy-side still relevant, given algos are “hard mapped”?

Or is it (or will it be) more about larger scale data analysis where answers are not often known in advance and the ability to “phone a friend” for a rapid response not available?

Looking a bit deeper, we also see challenges around the use of aggregated data: taking averages over decent sized data sets should mean “the data speaks for itself”, but does it? Comparability across broker performance or, in our case, across client performance is sometimes challenged based on the compactness of your cluster, as a simple case in point.

Hugh, how do you see the buy-side adjusting and also how is the buy- and sell-side adjustment to servicing being dislocated, if at all?

Hugh Spencer, Janus Henderson (Singapore)
Hugh Spencer:
Brokers and providers of electronic solutions that fit into the construct of a platform that places a greater emphasis on the evolution of execution methods are naturally incentivized to provide new ways to optimize customer results. To further promote the spirit of exploration, it is vital to create a complementary framework whereby the qualities that exist outside of a quantifiable universe are measured and rewarded appropriately.

Armed with the understanding and knowledge that their clients not only value but formally evaluate elements such as innovation, quality of daily interactions, adaptation to microstructure changes or connectivity to non-conventional liquidity, vendors and brokers become emboldened to not only create and offer a better product, but also to ensure they offer better overall levels of service.

This environment fosters the true spirit of partnership between client and broker. This highly communicative relationship can, in the long run, only add value for the most important stakeholder: the investor. It also galvanizes the idea that the restrictive nature of a purely quantitative based and automated system of execution is not only unsuitable for the full spectrum of asset managers, but that by building the road to bilateral exploration our firm will be more strongly positioned for the future.

SBP:
In turn, how does the algo sales-trader rise to meet those demands? What skills are required in that seat today? Has it changed? Should it change? How does that relate to high touch or program trading, if at all? And how does the total service offering from different or merged channels adjust to the changes on the client-partner side?

Ultimately the focus sits in quant. Asking traders to learn to code is a popular suggestion, but although beneficial to the individual, the extra risks probably outweigh any additional resource benefits in actual implementation.

A key strategic question is, how does an algo-sales trading desk move to a materially more quantitative approach that can handle (ideally) large data sets from hard coded, canned algorithms that reduce real-time requirements, but also maintain and develop that critical partnership on a qualitative level?
As you say, developing integrative negotiation solutions between client and broker that bring the wider algo platform skillset into play through trusted partnership, can result in materially improved outcomes for both sides across all three major regions of the world. It is a solid first step.

The Death Spiral Of Exchange Liquidity

Tan T Kiang, Grasshopper

By Tan T Kiang, Chief Investment Officer, Grasshopper

Tan T Kiang, Grasshopper
It is the responsibility of exchanges to create and maintain an infrastructure that ensures fair, low-cost trading and a competitive environment for diverse liquidity providers.

Few will object to the necessity of liquidity providers to create a healthy and competitive exchange. Most exchanges welcome market makers and end up creating strong and long-lasting symbiotic relationships with them. Nevertheless, providing liquidity has now become challenging in an environment of rising costs of trading.

Since early 2017, many conversations with different exchanges revolved around the dismaying fact that the number and breadth of liquidity providers in the marketplace has been steadily shrinking.
As the financial industry evolves, market making firms have to keep on adapting and innovating to fight for their market share. Firms which do not invest prudently in technology will end up being outdated or outmoded and eventually die.

The opposite is also true. Firms that spend unwisely or are too broad will suffer the same fate by collapsing under their monthly tech burn rate. The same goes for liquidity providers which did not upgrade themselves as the environment grew more competitive and, they eventually disappeared.

The microwave advantage
Among the market makers still around, one of the most controversial issues was the advent of the microwaves towers. Firms that adopted microwaves significantly reduced their latency, hence increased their edge over their competitors. But in doing so, they also dramatically increased their cost of trading.

In a high-volatility and high-opportunity environment, it may be a no-brainer to all players. But with the current sporadic volatility and short follow-through volumes, this is a dilemma with significant risk. How much more profit do you have to generate to pay the telco companies providing the microwaves towers, before you drown in your trading costs?
Many chose not to enter the microwave game, and decided to change their strategy and invest smarter instead.

Barriers to entry in the market making industry were much lower 25 years ago. Back then, all one needed in the pit was a trader’s jacket and a clerk. The environment was ripe for entrepreneurs to take the first step, and the market was accommodating enough to allow time for trial-and-error or for pivoting to their next successful move.

This was largely the healthy period of high-frequency trading where opportunity and competition gravitated towards an efficient and healthy marketplace. While this took significant capex, risk-taking and dedication, the rewards could justify the paradigm with relationship between market makers (liquidity providers and arbitrageurs), market takers (hedgers and speculators), and exchanges as largely symbiotic. Within each respective category, there were many players from short-term to long-term, arbitrageurs and quants, hedgers and speculators, and primary and secondary marketplaces.

The perils of homogeneity
However, those halcyon days of almost self-fulfilling liquidity and opportunity are now very distant. The decline in the number of liquidity providers is not only an issue in terms of category of player, it also reflects a wider picture of poor health in the whole environment.

Let’s use a grocery store analogy here. Before supermarkets, we had marketplaces filled with specialized stalls. Each merchant specialized in what they did and served the market well because their specialization enabled them to provide a unique and constantly optimised service to the marketplace.
Rather than being able to ask specialized merchants for their suggestions of the season, the pursuit of efficiency has forced the market to serve pre-packaged meat on styrofoam plates in one-stop-shop supermarkets.

So, when there are shocks in the marketplace, all the volume in the market disappears at once. Homogeneity makes markets thinner and price movements more violent, essentially making price discovery much less transparent or easy.

Over the past two years, we have witnessed an accelerated consolidation among liquidity providing firms. With increasing costs of trading, many firms have not been able to scale up fast enough to recover their operational expenses, and ended up being bought out by larger operators who benefited from economies of scale. Meanwhile, exchanges, having never before needed to stem the technological arms race of their participants, have scant idea how to react to the destruction of their participant diversity.
What if the volatility in the market never picks up? Investors won’t want to trade if there is no liquidity, but unless volatility and volume is maintained at a certain level of opportunity, market makers cannot offer liquidity and cover their costs. This becomes a death spiral of negative reinforcement. The systemic health of exchange products are controlled by far too few with far too much concentration risk.

Assuming that the market makers have done all they can on their end to keep afloat, we need to focus on the other side of the equation, which means turning to the exchanges, for a structural overhaul of the marketplace.

Exchanges can provide the remedies
In order to ensure fairness, exchanges have already been active in implementing some changes which prevented trading on the marketplace to become a “pay-to-win” game.
For instance, exchanges introduced colocation to market participants, to neutralize the land grab game.
By placing all the servers in the same location and ensuring that the wire length from the server to the matching engine is exactly the same for all market participants, colocation killed the need for players to buy the properties adjacent to the exchange in order to shorten their wires and hence reduce their time-to-market.

This was a first major step in the defence of a fair marketplace.
Unfortunately, it did not stop the race to zero latency among trading participants. As arbitrage opportunities among highly correlated products are time-sensitive, the search for the fastest access to data has continued and brought on the era of microwaves. This has increased the cost of competing to a highly unsustainable point for many liquidity providers.

Acknowledging the issue, Singapore Exchange has disallowed the use of microwaves on their sovereign territory, but until all other exchanges do so, the problem will remain. Instead of prohibiting microwaves, the exchanges should, as they did with colocation and land-grab, make their use irrelevant. In order to do so, the solution is two-fold.

First, it would require exchanges to bring the market data to a single local colocation point in each country, therefore nullifying the distance between each market participant and the data.
Second, exchanges need to implement speed bumps that would delay all access other than their own, to colocation.

The cost of implementing such infrastructure is minimal compared to the aggregated amount spent by all participants on microwave technology, and it could be shared among all market players. It is the responsibility of the exchanges to keep the marketplace fair with low cost trading and create an environment in which liquidity providers can keep it healthy.

It is high time that exchanges — individually and collectively — tackle this infrastructure overhaul. Not only for liquidity providers’ survival, but for their own.

Finding Liquidity With Minimal Slippage Costs

By Dr. Robert Barnes, Global Head of Primary Markets & CEO Turquoise, London Stock Exchange Group

Secondary market trading systems and venues must innovate to meet the demands of investors seeking higher returns.

Dr. Robert Barnes,  London Stock Exchange Group
Dr. Robert Barnes,
London Stock Exchange Group
Developed market demographics mean that people are getting older and living longer, but governments and companies offer few new final salary pensions, so we have witnessed the rise of direct contribution schemes.

The 2001 Wise Men Report, sponsored by the Economic and Financial Affairs Council comprising the economics and finance ministers of the European Union member states, provided the example that an individual with a career of forty years wishing to retire on 35% final salary must invest 20% salary each year for 40 years if achievable real return is 2% – yet today many in continental Europe face low to negative interest rates.

Coinciding with these macro and demographic trends is the search by long term investors, including insurance companies and pension funds, for growth. This is increasingly sought from equities and through exposure to companies from countries without negative interest rates such as emerging markets.

Primary market trends
London as a financial centre has seen an increasing internationalisation of capital raising. For example, in 2017 nine out of ten of the largest IPOs on London Stock Exchange were in non-UK companies – two of which were GDRs denominated in US dollars settling in Euroclear.

This trend continued in 2018 with significant dual listings from emerging markets, such as the successful issuance of Slovenia’s NLB – the largest bank IPO in Emea last year; and from Kazakhstan, Kazatomprom – the largest uranium mining company in the world.

In April 2019, London Stock Exchange was selected as the sole listing venue by Saudi Aramco for its Global Medium-Term Notes programme, which raised $12 billion in five tranches, and covered many times by demand topping $100 billion. This listing set multiple records, including: largest order book for an emerging market bond, largest corporate bond from Middle East, Africa or Asia, and joint-largest oil & gas sector bond ever.

The same day, 10 April, Network International achieved a record IPO listing in London as the largest ever technology and fintech IPO from Middle East and Africa to list on a global stock exchange. It was the largest technology IPO on London Stock Exchange since Worldpay – itself the largest global tech IPO of 2015.

London has become the global listing hub for fintech, the ideal listing destination for these fast-growing companies to raise visibility with customers and suppliers, where investors appreciate the strong governance standards and stable legal and regulatory environment that contribute to the strength and depth of experience of the community of payments companies increasingly present here.
There were also landmark listings in March 2019 of £220 million ($286 million) market cap vanadium producer Ferro-Alloy of Kazakhstan and $23 billion listing of Coca-Cola European Partners, switching its listing to London Stock Exchange.

In all these cases the community of international investors active via London contributed the majority of risk capital, and this is a great example of cooperation linking developing markets and London Stock Exchange’s international investor community.

Secondary trading insights
Markets must innovate to deliver mechanisms that help investors deploy capital into equities while minimising slippage costs of buying and selling, particularly in today’s environment of low real returns. Searching for growth and finding liquidity in stocks – with minimal slippage costs – is integral to contributing to long term investment returns.
For example, Turquoise, the pan-European multilateral trading facility majority-owned by London Stock Exchange Group, allows via a single connection, members to trade securities of 19 European countries and settle each trade in the respective country’s Central Securities Depository.
Turquoise effectively operates three parallel order books: one lit, one mid-point that also provides potential price improvement and quality execution for electronic blocks, and one for periodic lit auctions that welcomes orders of all size.

Investors are finding liquidity via Turquoise innovations designed in partnership with our stakeholders. Since launch in 2008, Turquoise customers have matched more than $8 trillion, and this number continues to grow with the increasing demand for equities of all sizes.

screen-shot-2019-05-27-at-3-36-46-pmFigure 1 charts the number of stock symbols that trade each month on the y-axis against time on the x-axis from January 2013 to March 2019. The observations are that the number of stocks in January 2013 active on Turquoise numbered less than 1700. By March 2019, more than 2,900 stocks had traded on Turquoise. Why does this matter? Because when one realises that approximately 80% of all value deployed onto all stock exchanges and platforms across the UK and Europe concentrate in just the top 300 blue chips, the fact that the number of active stocks is increasing – with a particular surge following the 2015 introduction of negative interest rates – demonstrates that investors seeking growth of returns in equities are succeeding in finding liquidity in blue chips to mid- and small-caps via Turquoise innovations designed in partnership with the buy-side and sell-side community that complement those of the primary exchanges.

Asset managers have published views about the role of exchanges in well-functioning markets and the need for innovation in mid-point and electronic block trading. A consortium of global buy-side and sell-side initiated Plato Partnership to study and improve market structure in Europe – they selected Turquoise as the industry’s preferred partner. At last year’s Asia Equity Trading Summit, asset managers shared insights on the success in Europe of the Turquoise Plato market model developed in partnership with the investor community.

Since then Turquoise Plato ended 2018 as the fastest growing and biggest dark pool – achieving all-time record activity. Turquoise Plato is now number one of 20 venues evaluated by Rosenblatt Securities.

screen-shot-2019-05-19-at-8-29-42-pm
Turquoise Plato’s average daily turnover in Q1 2019 continues its trend of tremendous growth (Figure 2) by offering investors a single order book of multiple functionalities – continuous trading for immediacy and periodic random uncrossing featuring low price reversion after the trade – where pre-trade, no price nor size information is displayed to minimise market impact, and where after a trade, all price and size information is broadcast real-time to all market participants. All Turquoise Plato trades match at midpoint of the primary best bid and offer for potential price improvement. Fast forward to March 2019, and customers using Turquoise Plato Block Discovery for larger sized orders have traded more than €180 billion ($202 billion). The insight is that continuous midpoint and electronic block trading at midpoint work and Turquoise is fully adopted by the global investor community, ready to scale beyond UK and European markets.

Turquoise customers on 31 January 2019 set a new daily record of €653 million value traded via Turquoise Plato Block Discovery, contributing to a new weekly record of €2,581million during 28 January to 1 February 2019. Turquoise Plato Block Discovery matched €602 million on 17 April 2019, another daily record above €600m.

screen-shot-2019-05-19-at-8-29-49-pm
Figure 3 shows an intraday price chart where bigger trade sizes are represented by larger bubbles. In this example, trading is fairly consistent on Turquoise Plato Block Discovery with most activity matching in the morning. This complements well primary exchanges where there is a relative peak ahead of the closing auction at the end of the trading day.

Turquoise Plato Lit Auctions offer another quality execution channel featuring pre-trade transparency and multilateral liquidity for trades of all sizes. While average sizes of European equities remain around €10,000 per trade, Turquoise Plato Lit Auctions has recorded trades both small and a material portion above large -in-scale, including trades above €500,000 in size spanning stock names of 15 countries. Quality is high with low price reversion recorded after trades. 

Exchanges To Acquire Data Businesses

Exchanges are expected to make acquisitions to expand their data businesses over the coming year and enter the alternative data space, according to Opimas.

The management consultancy said in a report, Exchanges: Innovation and New Business Models to Drive Growth, that selling market data has been a key part of exchanges’ business model in order to generate revenues streams that are less volatile and cyclical than transactional fees. The study continued that some exchanges now generate far more from data than they do from trading and clearing, including London Stock Exchange Group and Switzerland’s SIX, if revenues from the latter’s subsidiary, SIX Financial Information, are included.

Octavio Marenzi, Opimas

“Data still account for a minority of revenues for most exchanges,” said the report. “Over the coming year, we expect to see a number of these exchanges make acquisitions to bolster their data businesses, as they continue to seek additional revenue streams.”

However the increasing cost of market data from exchanges has led to complaints from members. Octavio Marenzi, founder and chief executive of Opimas, said in the report that these complaints are misplaced as market data revenues have been falling at some of the largest exchanges including CME, Deutsche Börse and London Stock Exchange Group.

“For those exchanges where we have seen strong growth, this has typically come from areas such as indices or analytics and has been fuelled by a large number of acquisitions in the area, rather than organic growth,” he added.

Nasdaq recently reported results for the first quarter of this year and said in a statement that market data comprised 16% of total net revenues at $100m, the same as in the first three months of 2018.

Opimas identified Nasdaq as the exchange which has pursued alternative data most aggressively, creating the Nasdaq Analytics Hub in 2017 and acquiring Quandl, an alternative data provider, last year.

“While Nasdaq has staked out a position in alternative data, other exchanges have been reluctant to follow,” added Marenzi. “However, we expect to see more exchanges enter the fray, since it is a natural extension of their existing market data and index businesses.”

Nasdaq reported that investment data & analytics were at $39m in the first quarter of 2019, up $15m year-on-year.

Indices

The consultancy said exchanges have also diversified through acquiring indices. Nasdaq reported that its index business contributed 9% of total net revenues at $54m in the first quarter of 2019, up $4m from a year ago. The exchange said ETP assets under management tracking Nasdaq indexes increased 13% year over year to $196bn at the end of March 2019.

Opimas said the European Union’s Benchmark Regulation (BMR) has also provided a boon to index providers, which have been able to levy additional fees to users of their indices for regulatory reporting.

This month Deutsche Börse said in a statement it was acquiring Axioma, a provider of cloud-based portfolio and risk management software, for $850m and combining it with its STOXX and DAX index businesses to form a new company.

Sebastian Ceria, founder and chief executive of Axioma, said in a statement: “The union of Axioma, STOXX and DAX under the Deutsche Börse umbrella creates a growth company that is uniquely equipped to help clients capitalize on the critical trends now reshaping the investment-management landscape.”

Deutsche Börse and Axioma have had an existing partnership since 2011 and have jointly developed products, including factor indices and exchange-traded fund offerings.

Liquidnet To Expand Data Offering To Buy-Side

Liquidnet, the institutional investor block trading network, will launch a data offering to help asset managers capture more alpha following its acquisition of RSRCHXchange, a marketplace and aggregator for institutional research.

Brian Conroy, president of Liquidnet, told Markets Media: “We are continuing our quest to solve problems in our industry by using technology to make investors’ lives easier.”

Liquidnet recently announced the acquisition of RSRCHXchange, which was launched in 2015 to distribute research from a variety of providers to asset managers through a centralized, cloud-based hub.

Conroy added that RSRCHXchange makes delivery of research easier and more robust and the firm’s ethos and culture fits with Liquidnet. He joined Liquidnet in February this year in New York from Fidelity International in London where he had been president. Prior to Fidelity, Conroy was president of Fidelity Capital Markets and global head of equity trading in Boston for FMR.

Brian Conroy, Liquidnet

“With my background in asset management and Liquidnet’s integration of OTAS Technologies we recognise an opportunity to increase efficiency,” he added.

Liquidnet acquired OTAS in 2017. OTAS was launched in 2011 to analyse market data and highlight actionable information for equities trading to fund managers in an easily digestible visual format. Software analyses changes from the normal pattern in data such as insider transactions, short interest, options and credit default spreads and automatically highlights the most relevant signals for stocks in their portfolio for review.

Conroy said the addition of RSRCHXchange allows Liquidnet to provide a new level of research and analytics more efficiently so the buy-side can capture more alpha.

“We are running a pilot with large asset managers in the US over the next few months and will launch a cohesive offering that is driven by our members,” he added.

MiFID II unbundling

Vicky Sanders, co-founder of RSRCHXchange, told Markets Media that MiFID II was a catalyst to launch the firm but the real driver was the lack of technology being used in research distribution.

Vicky Sanders, RSRCHXchange

“We wanted to use technology to distribute research in the same way as it is used in other industries such as music and video,” she said.

MiFID II required the unbundling of research payments from trading commissions, and as a result most asset managers have chosen to pay for research out of their own revenues.

Conroy said: “We want to provide all types of music and this is just the beginning.”

Approximately 1,200 fund managers subscribe to RSRCHXchange and Sanders said their client list is complementary to Liquidnet. She said: “We are bigger in Europe where we launched and have a larger number of smaller and medium sized asset managers.”

In addition, approximately 400 research providers contribute to the RSRCHX platform, with nearly 40% of the research coming directly from investment banks and sell-side brokers.

Sanders and co-founder Jeremy Davies will continue to oversee the day-to-day operations of RSRCHXchange and work closely with the Liquidnet team to develop an integrated solution, reporting directly to Conroy.

NovitasFTCL acted as the exclusive financial advisor to RSRCHXchange. The firm was owned by management, NEX Opportunities (CME Group) and private investors.

Sandy Bragg, principal at consultancy Integrity Research, told Markets Media that for RSRCHXchange, the acquisition offers broader access to US-based asset managers and technology support for its infrastructure.

“The buy-out is a welcome relief after MiFID II put a damper on purchasing the platform’s core offerings of independent research, as the European buy-side concentrated research purchases on its largest broker relationships,” Bragg added. “For Liquidnet, the acquisition is more fraught, as its core trading audience is increasingly separated from research. Retooling RSRCHXchange as a virtual sales trader pitching investment ideas is an interesting concept, but might be difficult to execute.”

Targeting The Close

Andrew Royal, Deutsche Bank

By Andrew Royal, Head of APAC Autobahn Analytics and Algorithms, Deutsche Bank

Andrew Royal, Deutsche Bank
A target close algorithm is designed to provide a trader with a lower impact approach to trade with a close price benchmark.

In general, there is a tradeoff that needs to be made: Price impact can occur when participation rate is too high, and as a result cost may increase for a given volume. Even if we attain the close price exactly, there is still a market impact due to the existence of our volume – the price could have been more favorable. The alternative is to start trading early with a lower participation rate, but this exposes the trader to price and time risk.

The price risk/expected impact tradeoffs can be graphed in an idealised setting. Impact will increase as we get closer to the end time and participation rate starts increasing rapidly – this is the red line in figure 1. Conversely, price risk declines as we get closer to the end time – this is the green line in figure 1: 0001

In markets that are liquid and have a close auction mechanism, executing all volume during this session is more likely if your order is not a large proportion of the close. For example, Australia close auctions generally trade around 22% of the full day volume (source; Deutsche Bank, February 2019) – small orders of less than 5% ADV will tend to get fully executed during this session with little to no price impact. From a modelling perspective, the more interesting problems come about from large orders that are expected to create some degree of price impact.

Intuitively, therefore, we have two main cases:
– High expected market volume is the easy case; we don’t expect much market impact and the best is to start as late in the day as possible in order to get as close to the close price benchmark.
– Low expected market volume implies high order participation rates for a given order size. To avoid the impact from high order participation rates, we must start earlier in the day but the trade off is we incur extra price risk.

The risk appetite of the client will determine how much price risk they value per unit of price impact. The sum of both risks gives us a minimal total risk – this allows us to calculate an optimal start time.

When volumes spike up, market impact tends to decline purely as a result of lower expected participation rate. In figure 1, this pushes the start time closer to the end of day for a given price volatility profile. What the client will actually see is not the tradeoffs that the strategy is making behind the scenes, but the following what is shown in figure 2.
fig2-page-001

Estimating future volume
As a result of the optimal trade off considerations, good stock volume and price volatility predictors are very important if we want to reduce impact in a consistent way. In what follows we shall focus only on the stock volume prediction problem.

fig3-page-001
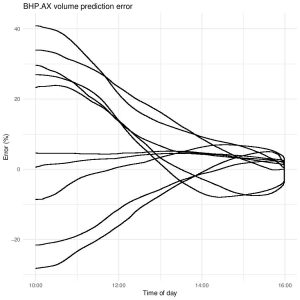
Some examples of how a volume predictor calculates the full day volume are shown in figure 3.
A volume predictor using Bayesian inference can be used to incorporate new data as it arrives throughout the day. As expected, we reduce forecast error over the course of the day.

fig4-page-001
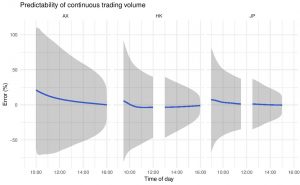
We can aggregate all of these sample paths to give a view of how the average stock will perform as in figure 4. The blue line in the plot below shows mean-bias (zero is perfect estimate), while the grey zone indicates standard deviation around the mean bias line. As one expects, the grey uncertainty zone narrows as more information is incorporated into the volume predictor and gives us better estimates. By midday we have eliminated much of the uncertainty, and we can then use this information as input into start time algorithm.

fig5-page-001
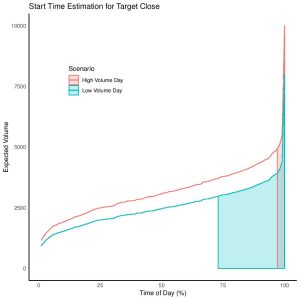
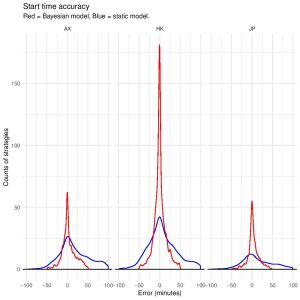
Optimal start times can be inferred for a 10% ADV order running at an expected 10% participation across each region. Generally, the start time is unbiased, but the accuracy as measured by the standard deviation declines dramatically by choosing the Bayesian volume predictor as shown in figure 5. Here, a positive error means we start after the optimal time – we will incur greater expected price impact as a result of running at a higher participation rate than expected.

Conclusion
The target-close algorithm is a necessary tool to better manage large ADV orders with a close price benchmark. A properly constructed target-close model allows traders to mitigate their market impact by balancing it off against price risk. 

This article describes market specific modelling techniques used at Deutsche Bank that are aimed at striking this balance that reduces the price impact of large orders with a close benchmark. Deutsche Bank is continually evolving its execution algorithms with a focus on building data driven improvements into the product. Target Close is available in all Autobahn 2.0 markets in APAC.

We're Enhancing Your Experience with Smart Technology

We've updated our Terms & Conditions and Privacy Policy to introduce AI tools that will personalize your content, improve our market analysis, and deliver more relevant insights.These changes take effect on Aug 25, 2025.
Your data remains protected—we're simply using smart technology to serve you better. [Review Full Terms] |[Review Privacy Policy] By continuing to use our services after Aug 25, 2025, you agree to these updates.

Close the CTA