The London Stock Exchange is enabling iceberg and hidden orders to be executed during the closing price crossing (CPX) session rather than the closing auction from 8 December. On the same day, Euronext will introduce an auction volume discovery (AVD) order type.
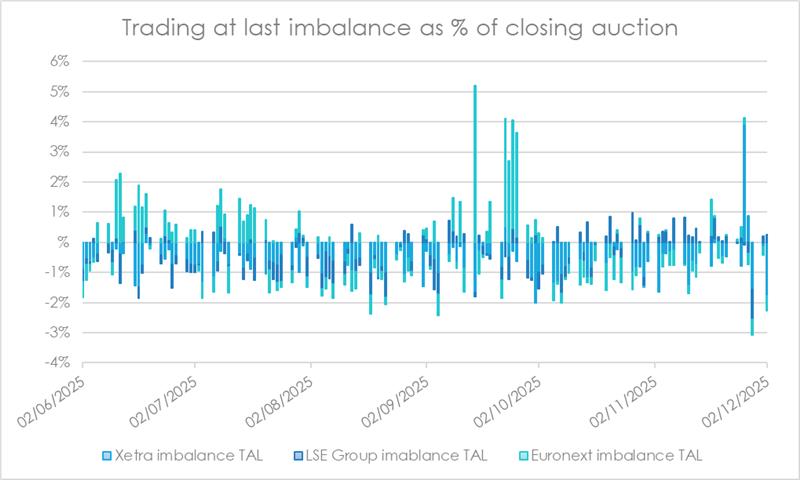
Native venues offer trading at the closing price for a period of up to 10 minutes post-closing auction. Trading then happens against the closing imbalance, with the buy or sell orders left unfilled at closing price routinely being up to 5% of the closing auction.
LSE’s CPX session immediately follows the closing auction, allowing users to trade at the closing price without providing full pre-trade transparency. Following the launch, it will be possible for hidden and iceberg orders to be targeted to the CPX at any point in the trading day, using CPX Time in Force (TIF), or during the session. This will help to increase post-close liquidity, the exchange stated.
Tom Stenhouse, head of product for equities at the London Stock Exchange and Turquoise, explained, “Participants with large orders often limit their allocation to the closing auction itself to reduce market impact during the price formation, but would be willing to trade significantly more volume at the closing price.
“These changes mean that any excess volume can be entered as non-displayed orders ready to execute immediately after the closing auction against any available contra liquidity. Then, as a further opportunity, if an order is not fully executed initially, it can rest without any pre-trade transparency for up to five minutes should new demand for trading at the closing prices arrive.”
Similarly to LSE’s project, Euronext’s ADV orders will allow market participants to send a non-displayed order during the day and then trade at the closing (or opening) auction price. Orders will not be published, preventing information leakage and facilitating block trading.
Deutsche Borse will follow suit next year, announcing last month that it will offer auction volume discovery in the scheduled continuous auction trading model. Version 12.1 of the T7 electronic trading platform will be released in simulation from 23 March, before being officially introduced on Deutsche Börse Xetra and Deutsche Börse Frankfurt on 18 May.
These new offerings come amidst competition from multilateral facility providers such as Aquis offering trading at close, who compete with native venues over related trading fees and order types.
Alongside this expansion, LSE is also introducing a new matching engine. Some instruments will be moved to Partition 4 on 8 December. This will impact certain trading and market data technical specifications, with some messages having new tags added.
For the 17 segments affected by the change, good-til-date (GTD) orders in the customer development service (CDS) were cancelled on 14 October. Production orders will be cancelled on 5 December.