Home Blog Page 472

Asset Management’s Time for Transformation

By Gurvinder Singh, CEO, Indus Valley Partners

Gurvinder Singh, Indus Valley Partners

Coming out of 2018 alive was no small feat for the average asset manager as funds began adapting to rising fee pressures through various consolidation endeavors and a crackdown on headcount. Not only have these struggles carried into 2019, they continue to grow in severity as the growth of funds are being largely derived from market value. In order to best prepare for 2020 and beyond, managers must shift their focus and resources to reducing operational costs if they want to survive in an environment of market uncertainty and continued AUM stagnation.

In a recently published report, Boston Consulting Group (BCG) sampled 30 global asset managers with a total of $39 trillion AUM to examine market performance’s impact on profit margins. Comparing the current market environment to what a potential downturn scenario could look like for asset managers in 2023, findings point to serious margin compression, with the best-case scenario being 32% profit margin and the worst being 25%.[1] Taking this possibility of a market correction into account, funds need to reduce their costs by 20%-30% per year on average moving forward to retain a traditional high margin typical of the asset management industry.

As macroeconomic pressures continue to mount and the squeeze on margins becomes tighter, a fund’s ability to adapt to changing environments has become vital. In the aforementioned BCG report, it is noted that a firm in the $250 billion to $500 billion range typically incurs average costs of 19 basis points, which is more than both of their larger and smaller peers.[1] With smaller players having the ability to make quicker shifts and the larger ones capitalizing on their operational scale, the medium-sized asset manager has been facing tighter competition on all fronts – until now.

A viable alternative to monolithic outsourcing – hyperoutsourcing and data management

Hyperoutsourcing: verb
hyperoutsource, hyperoutsourced, hyperoutsources.                                                                                                 Digitally unbundling a fund’s specific operational processes by harnessing “digital-first” providers to exchange key data sets on an intraday basis.

Asset managers implementing traditional outsourcing programs have found their outsourcing options to be “monolithic” and slow. With their platforms deeply rooted in a well-defined set of processes, traditional outsourcing providers do not possess the agility to provide asset managers with access to technology and innovative products, leading to a potential downward spiral in terms of product innovation and growth.

It once made sense for an asset manager to harness a monolithic outsourcing provider for a scenario where they had a vanilla, static business or where their own internal inertia was so large that it blocked any change management programs. However, the advent of “digital-first” outsourcing providers now enables managers of all sizes to implement a scalable hyperoutsourcing strategy for better results than what the traditional monolithic outsourcing providers have to offer.

With technology at the heart of their operating model, “digital-first” outsourcing providers are entrenched in the concept of “audit anytime.” By providing clients with full systematic access to core processing systems that the outsourced managed services teams use, “digital-first” providers tend to be more nimble and agile in embracing efficiency through the enhancement of technology in comparison to their larger counterparts.

A fund that sits between the $250 billion to $500 billion range can significantly lower their costs from 19 basis points to 12 or less by leveraging a “digital-first” operating model, which involves hyperoutsourcing and digitalization throughout the value chain. In fact, according to a Q2 2019 PwC insights report, margin compression has already forced many asset managers to consider outsourcing their back- and middle-office functions.[2] As a result, technology platforms and teams that were once built out internally have shifted over to less costly third-party providers, allowing for a greater focus on core capabilities around managing money, client experience and product innovation to generate and retain AUM.

The flexible and scalable approach of hyperoutsourcing allows a fund to start with a focused offering and create visible efficiencies. From here, these efficiencies can enable the next phase of evolution by setting a sustainable, long-term operating model transformation in motion. For example, you could choose a provider for loan settlements, one for providing a golden copy of data (i.e. reference, security, etc.) and add other functions-as-a-service all while leveraging a core data management capability in-house to stitch the data sets together.

The path to calmer waters

When strong data management is paired with hyperoutsourcing and “digital-first” providers, funds can achieve their ideal state in which they have full control of all internal data, including both historical and current. With this strategy, funds can be equipped with an unbeatable combination of flexibility and control, both of which are often sacrificed in an irreversible manner in traditional monolithic outsourcing models.

[1] Boston Consulting Group, “How Asset Managers Can Win in a Winner-Takes-All World,” May 6, 2019.
[2] PwC, “Deals from PwC: AWM Deals Insights Q2 2019,” 2019

Operational Use of Advanced Analytics Set to Grow 180%, Alt Data by 70% in Next Three Years

Business graph with arrow showing profits and gains financial on the stock exchange.

Element22, a boutique data and analytics advisory firm serving the financial services industry, announced the results of its second benchmark study, which was conducted in partnership with Greenwich Associates and sponsored by UBS Asset Management.

This comprehensive study revealed explosive growth is anticipated in the use of advanced analytics and alternative data over the next three years but found that 77% of asset managers overestimated their advanced analytics and alternative data capabilities.

The study highlighted that asset managers are at varying stages of their journeys to develop robust advanced analytics and alternative data capabilities. The former principally includes Machine Learning (ML) and Natural Language Processing (NLP), with Smart Robotic Process Automation (SRPA) largely in trials. Some key observations from the study:

  • Roughly 70% of firms remain in the early stages or have just begun their journey, but more than half of respondents reported that business stakeholders are satisfied or very satisfied with their data and analytics programs. This contradiction could be explained by modest expectations for immature programs, or it could indicate that asset managers are significantly overestimating their progress early on. Independent wealth managers expressed the greatest dissatisfaction with their advanced analytics and alternative data programs.
  • Asset managers who are pursuing advanced analytics and alternative data strategies are investing heavily in their programs, with the four most aggressive managers investing 67% of the total annual investment made by the entirety of the respondents. In general, managers spend anywhere from less than $1 million to over $100 million annually with the median skewed all the way down to below $5 million. Last year, the top three firms reported 33% of total spend among participants on alternative data, ranging from $1 million to $100 million annually, with a median spend falling just below $10 million.
  • While asset managers are making substantial investments in advanced analytics and alternative data today, evidence suggests an order of magnitude more will be required to realize sustainable value. Across all four investment categories surveyed, those in the early stages are, as a group, the ones most consistently planning to increase investments, with 90% reporting planned increases.

In terms of the application of advanced analytics and alternative data by asset management firms, the study found:

  • Of the survey participants, 49% have an analytics strategy in place and 63% have one for data.
  • 49% of those surveyed are using alternative data for the purposes of alpha generation, on par with 50% last year, while another 17% are in trials and proofs of concept (POCs).
  • Last year, ML stood out as the most mature type of advanced analytics solution, with 90% of asset managers surveyed deploying it in some way. This year, 100% of the managers surveyed in the later stages of the journey are using machine learning to some extent and even 9% of the managers at the starting stage are generating value.

Asset managers tend to have a data strategy when they are in the initial stages of the journey and progress to both an analytics and data strategy as they mature to the middle of the journey and beyond. The findings suggest that asset managers have undertaken targeted trials and POCs as a means of learning, evaluating potential value, building skillsets and gaining buy-in while at the same time containing costs and risks. In the early POCs, asset managers experience more misses than hits, but it is the few hits that build confidence and generate the support that lead to much needed investment capital to build fully-fledged capabilities.

Commenting on the benchmark study, founding partner of Element22, Predrag Dizdarevic, said, “This year, by expanding the scope of our survey, we were able to assess a broader cross-section of the industry, revealing increased insight into firms at all phases of their journey in the use of advanced analytics and alternative data. A key finding is that many firms in the early stages overestimate their progress, but even the most advanced asset managers realize they will need to continue to invest heavily to find new ways of generating alpha, and they acknowledge this is a journey without a final destination.”

UBS Asset Management has been advancing the use of data and advanced analytics for 4 years on behalf of their clients and investment teams. In addition to sponsoring the benchmark report for the second consecutive year, UBS Asset Management served in an advisory role by providing guidance on the report’s rigorous research methodology, framework and content strategy, as well as insight into trends transpiring in the industry.

Thomas Heinzl, Chief Operating Officer, UBS Asset Management, said, “The research underscores the importance of investing in data and advanced analytics to drive efficiencies and process changes, along with the ability to generate returns. We began our analytics program four years ago by focusing on operational improvements, which allowed us to combine our own data with external data sources. By applying machine learning techniques, including natural language processing, we are able to enhance and augment the work that our portfolio managers and analysts do, demonstrating our ability to leverage technology to drive alpha for our clients.”

The Element22 Analytics Power 2019 report can be downloaded here.

Passive Environmental, Social, and Governance Investing is Set to Grow

The integration of environmental, social, and governance (ESG) considerations into passive investing is gathering momentum, but there are potential pitfalls ahead, according to the latest The Cerulli Edge—Europe Edition.

The proliferation of new indices constructed to tilt and weight benchmark components in accordance with investors’ climate, social, or governance priorities is increasingly fueling industry debate on how to meaningfully integrate ESG considerations into passive strategies, says Cerulli Associates, a global research and consulting firm.

Fabrizio Zumbo, associate director of European asset management research at Cerulli, says that rapid innovation in smart beta and factor investing is one of the main catalysts of increased product availability for European investors. Although demand for responsible investment indices is expected to keep growing, the risk is that they could fail to match the sustainability criteria investors believe they are buying.

For example, environmental-themed indices typically tilted away from big polluters initially. The next phase was to tilt away from companies with large fossil fuel reserves. Now the emphasis is on increasing exposure to companies with revenues exposed to the “green economy.” However, climate risk and its potential impact on portfolios in the future is a complex matter. The issue is further complicated by the fact that managers are packing different visions of—and beliefs about—ESG into their low-cost products.

The successful integration of ESG into passive strategies will, however, ultimately depend on managers being able to enhance their stewardship of and their engagement with the thousands of companies they track, says Cerulli. The difficulties include managers’ limited capacity to dynamically monitor the huge number of companies contained in the indices they track, a shortage of meaningful forward-looking data, and the absence of universally agreed ESG definitions, concepts, and beliefs.

The credibility of passive ESG strategies will be at risk if, for example, passive exchange-traded funds (ETFs) do not match the sustainability criteria investors think they are buying. ETFs tend to use benchmarks offered by the major index providers, but they may have little predictive power. In addition, portfolios created using different scoring systems are likely to have radically different constituents, resulting in different outcomes depending on which methodology they use.

Nevertheless, according to Zumbo, “Passive managers as well as large active managers that have entered the passive space have a real opportunity to offer robust stewardship and deep engagement with their investments. They can leverage their long horizons and sizeable stakes to provide effective ESG options in the passive space.”

OTHER FINDINGS:

• London-listed closed-end funds raised £6.6 billion (US$8.3 billion) in the first nine months of this year, up 20% from the same period in 2018, notes Cerulli. The bulk of this capital went into specialist property, debt, and renewable energy investment companies. Family offices and similarly sophisticated investors are behind much of the demand for closed-end funds.

• Europe’s pension schemes are looking to extend their fixed-income investments to the entire spread of the credit market. Some 14% of the respondents to a Cerulli survey intend to increase their allocation to high-yield bonds and 15% plan to increase their investments in emerging market debt.

Who Pays for Price Discovery?

One of the things financial markets do really efficiently is to isolate whatever economics are in the system and to allocate them as assets and price risks.

That’s even true of trading economics. We’ve already seen how inverted venues are used to “buy” queue priority by those with urgency for a fill, as well as how algorithms seem to be increasingly deploying dark mid-point orders and odd lots to minimize costs. This effectively counteracts some of the inefficiencies of artificially wide spreads for high and low priced stocks.

Unfortunately, most of the market structure debates argue a classically oversimplified view of U.S. equity markets. A more complete view of U.S. market structure shows that the costs of markets are also pretty efficient at allocating resources and costs to participants. That is inclusive of (rather than despite) incentives to attract liquidity, tiers to offer economies of scale and cross subsidies on platforms with joint products—all of which are commonplace in the broader industry.

Even so, U.S. equity market is still the most transparent, cheapest and most liquid market in the world, and recent regulatory changes have only increased that transparency.

That’s partly because markets have solved for some of the more complex trading rent and revenue allocation decisions.

Who benefits from lit quotes?

Let’s start with trading and quotes.

Price discovery is important to all investors. The NBBO provides a benchmark for retail executions as well as a guardrail for dark pools. And yet few of those participants contribute to price formation. An economist would say the off exchange trades “free ride” off the quotes of others. But even that’s not really true.

One key reason for this, is that when Reg NMS was created, regulators confirmed that all investors should pay for NBBO data at the point of a trade, generating either “SIP revenues” or “top-of-book” revenue for the exchanges.

This means that although retail investors and dark pools might never trade on exchange, by buying the SIP or top-of-book data in aggregate, they do contribute revenues to exchanges who are providing good quotes.

Who pays for lit quotes?

Those same regulators decided that SIP revenues would be allocated to exchanges based on each exchanges contribution to price discovery and market share. It’s not enough to have high trading market share, half of the revenue allocation is for having stable quotes at the NBBO. Likewise, exchange top-of-book data in aggregate is only valuable if the exchange is generally at the NBBO.

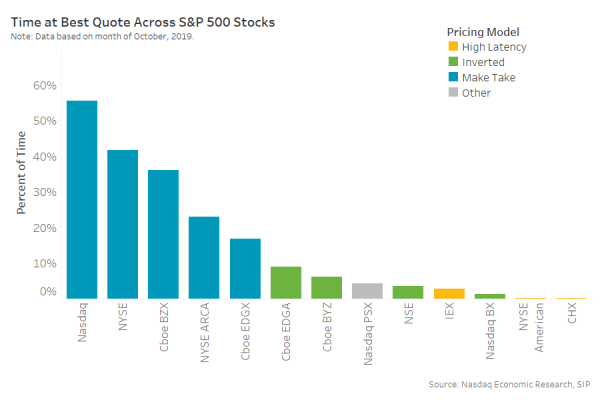
Our data has shown that only exchanges that offer incentives for liquidity provision have quality quotes (Chart 1). This can be done in a number of ways. Some venues offer queue priority for market makers, although it’s most common to offer financial incentives to anyone that provides lit quotes—the so called maker-taker model.

In contrast, we’ve seen recently how exchanges that don’t focus on the economics of lit market quality see spreads and liquidity can both be worse.

Chart 1: Data shows that maker taker venues are far better at providing price discovery than other venues

Time at best quote across S&P 500 stocks

The market allocates the costs across the platform

A taker could say that they are paying for lit quotes, via their take fees. However that’s only partly true.

In fact an earlier analysis seems to indicate that although takers pay take fees, they also benefit from lower spreads and more liquidity at the touch, which reduces their taking costs. The fact that market forces are at work likely means the allocation of costs are a more efficient than it appears, even in our decimal trading world.

Most exchanges have also discovered that the best liquidity providers tend to do a lot more trading than average investors. Charging everyone an “equal” price to trade wouldn’t be fair to those liquidity providers. Offering decreasing marginal costs is not only standard across most industries, it also increases market quality for everyone.

In fact Nasdaq offers the best economics to market makers that contribute to smaller cap quotes and liquidity too. That might be a “cross-subsidy,” but it’s also a public good.

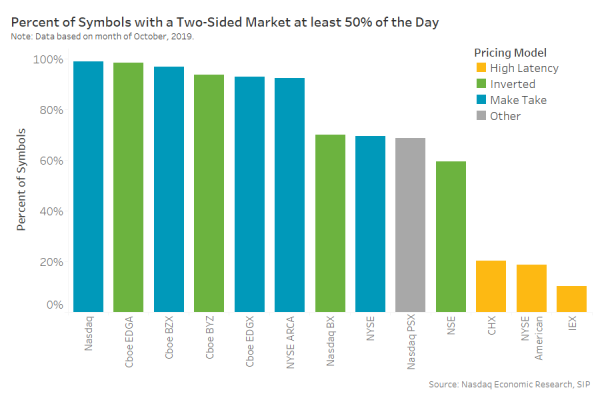
Chart 2: Two-sided market across exchanges

Percent of symbols with a two-sided market at least 50% of the day

Importantly too, exchanges don’t keep all of the SIP revenues and take fees paid to them either.

Public data on exchange pricing shows that the best quote providers often earn higher rebates than the take fees they pay. Economically that results in SIP revenues and take fees being shared with those who contributed to the quotes, and in a ratio consistent with their contribution.

In addition, the U.S. market is so competitive that most TRF revenues are actually passed back to the off exchange venues that produced them. That means the wholesalers filling retail trades are actually receiving SIP revenues in response to their retail trades executed.

Don’t forget what’s important to issuers

Issuers are often forgotten in the market structure debate. But in my meetings with them, most expect their exchange to ensure that their stock trades well, so investors are confident in buying their stock. That’s another reason why it’s important for a listing-exchange-platform to focus trading economics on improving market quality.

But investors shouldn’t forget the value a listing brings to the industry too. Without public companies there would be no opportunities for investors to build wealth from equities, or tickers for traders and hedgers to trade.

Although investors might feel it’s unfair that market makers receive so many incentives, remember that investors benefit from the income and gains of long term investing, as well as the lower spread costs when trading.

Importantly, issuers also benefit from efficient markets. As we saw recently, even slight improvements in quotes can materially reduce WACC and boost valuations.

What about data revenues?

So what about proprietary data?

From an economic perspective, prices and trading are “joint products” of an exchange. One would not exist without the other.

What does this mean?

Consider how bond markets work. Without exchanges to produce data, few downstream data products exist. In fact, most investors aren’t even able to measure best execution.

But for equities, the existence of exchange data allows for many investors to compete with equal information and access to build profitable businesses. Whether that’s a trading strategy, a data terminal, a stock screener or a downstream application like TCA.

In fact a recent WFE paper “challenges the notion that (it’s fairer to) engineer any value transfer from those who create the product; to those in the financial markets who wish to exploit it for their own commercial ends.”

Logically, both trading and data have value to different parts of the industry, and in fact we see that different customers buy each. Economically, it makes sense to sell both. Interestingly, our data shows that exchanges who charge for both are actually cheaper than those who offer data free (Chart 2).

To an economist that’s not surprisingly, as free things result in inefficient allocation of resources, something IEX recently discovered.

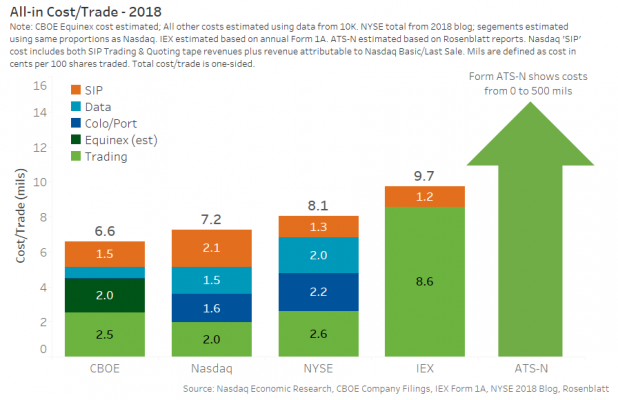
Chart 3: Net costs of trading on most exchanges is small

All-in Cost/Trade

Regulators have been critical of tiers and cross subsidies on exchanges. However the latest ATS-N disclosures (used for Chart 3) highlight just how commonplace they are. ATS charges are being reported as ranging from “free” to over 500mils, with one ATS even offering incentives. The move to commission free retail trading highlights similar platform economics in that side of the industry. Importantly, all three (ATSs, Retail and Exchanges) compete with each other for trading and liquidity.

Are direct feeds fair?

The “direct feed” debate is complicated by the fact that the SIP already exists.

However, it’s important to realize that something as simple and affordable as the SIP is perfectly adequate for retail. For a few reasons, the SIP is all they need:

  • Retail rarely trades on exchange.
  • Their trades are typically so small that they don’t trade with Level 2 or full depth data.
  • Human reaction times are much slower than the SIPs (SIP processing time is around 300 times faster than the human eye can blink, even including geographic latency).

Arguably, SIPs also offer plenty of data for most eyeball traders (buy-side, Financial advisors, etc.) too, who aren’t building algos, but need to monitor market prices and volumes at human speed.

Who should pay for market depth data?

In contrast, professional investors, with much larger orders, often demand faster price feeds and much more information. Some say this should be added to the SIP, but ironically that would:

  • Add to the costs of the SIP (and be borne by every investor whether they want it or not).
  • Not remove geographic latency.
  • Slow the SIP down even more (thanks to all the additional processing required).
  • Add more data to the government mandated monopoly thus stifling innovation.

A better solution for all participants is to provide choice so that professional investors buy the additional technology and data they need separately, as they currently do. In fact our data shows that not all professional investors have the same appetite for direct feeds data and colocation capacity. The user pays solution results in less free riding or cross subsidies.

There is perhaps no better example of this in the current debate than IEX’s DPEG formula, especially because of their position on so many of these issues.

Not surprisingly, their regression shows that maker-taker exchanges have the most informed prices, despite the fact that they have openly criticized the maker taker model.

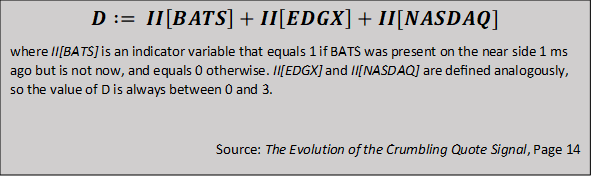
They then use those direct feed prices from competitors, combined with a speed bump on incoming take orders, to allow their calculator to fade resting orders before the takers arrive at their venue.

Chart 4: IEX’s DPEG product relies on depth data from maker taker exchanges, because their regression models show that’s the best way to get price discovery information

IEX’s DPEG product relies on depth data from maker taker exchanges

We estimate that the majority of IEX’s revenues require depth data from other exchanges. On that basis it’s not surprising they’d prefer all that data to be free, but according to their Form 1, IEX earns more than $70 million from matching and routing.

Getting inputs for their main product, from all of their competitors, for free, hardly seems fair.

We all benefit from centralized markets, let’s understand all the economics before changing specific policy

Considering each cost in our market in isolation misses the big picture. Most businesses in finance are platform businesses. In the case of listing exchanges, that platform brings many benefits: bringing companies to investors, creating transparent prices that are available to all and centralized liquidity for risk management and hedging. Those features makes the whole industry more efficient and investors are better off.

But competitive market forces allocate the complex economics of trading, data, colocation and listing among participants, resulting in economics being shared between participants.

The main argument seems to be whether those that create the most value extract enough of the rents.

TAIFEX: The Right Venue of Hedging Global Tech Supply Chains

Finance symbols of stock market

In October 2019, following the successful launch of Dow Jones and S&P 500 Futures, Taiwan Futures Exchange (TAIFEX) introduced the world’s first offshore Nasdaq-100 index futures – TAIFEX Nasdaq-100 Futures, to provide traders for hedging the volatile global technology supply chains on one of Asia’s most forefront trading venues. The product features a small contract size and New Taiwan Dollar denomination, and enables traders to implement intermarket trading strategies between Taiwan and the US. Further, it strengthens TAIFEX’s ability to cater to the growing demand in Taiwan and the Asia-Pacific for offshore technology-sector exposure, including the popular FAANG stocks.

TAIFEX Nasdaq-100 Futures successfully gains momentum with an average daily trading volume (ADTV) of over 1,500 contracts in just its first month of launch. Joining TAIFEX’s US index product suite of S&P 500 and Dow Jones, Nasdaq-100 completes the Exchange’s last piece in offering three most widely-tracked US stock indices. Notably, the Exhange’s Dow Jones Futures is the most heavily-traded Dow futures overseas with ten thousand contracts traded on a daily basis. Investors are provided a one-stop shop overseas to collectively manage their exposure in the US market outside the US exchanges.

October also saw the launch of TPEx 200 Futures. Covering the fast-developing semiconductor, life science and healthcare industries, the TPEx 200 Index tracks the 200 largest companies listed on the Taipei Exchange (TPEx), the listing board for Taiwan’s most innovative technology SMEs and start-ups. As the global economy faces increasing headwinds, product such as Nasdaq-100 Futures and TPEx 200 Futures will help traders across the Asia-Pacific adopt more sophisticated trading

Bond Connect Daily Volumes Top $1bn

Bond Connect, the platform designed to increased overseas investment in the Chinese interbank bond market, has reached daily volumes of more than $1bn (€0.9bn) as the country’s inclusion in bond indexes is expected to continue to boost participation.

The system was established on 3 July 2017 by the People’s Bank of China and the Hong Kong Monetary Authority. Investors executing Bond Connect trades can use global custodians for settlement, giving them convenient access to liquidity providers in China.

In 2017 Tradeweb Markets, the electronic marketplace for fixed income, derivatives and equities, was the first offshore trading venue to link to Bond Connect. Bloomberg connected at the start of this year.

Li Renn Tsai, head of Asia at Tradeweb, told Markets Media that the firm’s best month for Bond Connect was August this year with an average daily volume of $1.4bn.

“In October this year average daily volume was $1.2bn, 172% more than in October 2018, and we expect healthy growth in volumes to continue,” he added.

Tsai explained that volumes have grown to more than $1bn a day as foreign investors have increased participation and China has been opening up its financial markets. Index inclusion is also a significant contributor as Chinese bonds are being included in both the Bloomberg Barclays Global Aggregate Index and the JP Morgan Emerging Markets Index.

Enrico Bruni, head of Europe and Asia business at Tradeweb, said in a blog in July this year that institutions from 19 different jurisdictions traded on Bond Connect since the firm joined the platform.

Enrico Bruni, Tradeweb Markets
Enrico Bruni, Tradeweb

Bruni wrote that there is approximately $12.9 trillion outstanding in Chinese bonds but only about 2.4% of domestic debt is held by overseas investors. “However, based on the momentum and the trends we’ve seen so far, that percentage could change quickly,” he added.

He explained that an important driver of growth is the operational efficiencies that allow international investors to trade Chinese bonds using familiar, standardised, and automated protocols and workflows. Tradeweb offers its electronic multi-dealer request-for-quote mechanism for effective price discovery on Bond Connect and the allocation of block orders in Chinese yuan bonds was introduced in September last year.

Cui Wei, general manager of RMB Department at China Foreign Exchange Trade System (CFETS), said in a statement at the time: “The block trade allocation is one of three main factors for inclusion of China’s bonds into global bond indexes.”

The launch of block trades followed the China Central Depository & Clearing Co supporting real-time delivery-versus-payment on the platform.

Li Renn Tsai, Tradeweb

Tsai said: “The size of block trades has increased as Tradeweb has enabled pre and post-trade transparency. Block trading is a key functionality for asset managers and as foreign participation increases, the size of block trades will rise.”

In addition Tradeweb has offered its Automated Intelligent Execution technology on Bond Connect since last year. Clients can set parameters on AiEX for trades to be automatically executed without manual intervention.

“Tradeweb is the only firm that has enabled auto-trading on Bond Connect,” added Tsai. “As the Chinese bond market matures, more investors will allocate more trading to AiEX.”

On Bond Connect’s second anniversary Tradeweb introduced new features. The connection to CFETS allowed all Bond Connect participating dealers to contribute live streaming liquidity on a disclosed basis across bonds tradable in the Chinese inter-bank market, increasing pre-trade transparency.

“We will be building features to ensure that investors trading in China have the same typical experience as in other significant bond markets,” said Tsai.

Tradeweb said in its third quarter results this month that it had set new quarterly records for average daily volume in Chinese bonds.

Lee Olesky, chief executive of Tradeweb Markets, said in a statement:

Lee Olesky, Tradeweb

“We set new records for trading activity in the third quarter in rates and credit derivatives, European government bonds, mortgages, European ETFs and Chinese bonds, reflecting growth from both organic initiatives at Tradeweb as well as a number of longterm secular trends.”

2019 Women in Finance Awards Announced

At a gala event Wednesday night in downtown Manhattan, Markets Media announced its 2019 Markets Choice Awards — Women in Finance.

Congratulations to the winners!

Laura Davis Excellence in Marketing & Communications IHS Markit
Theresa Elamparo Excellence in Marketing & Communications
Tier1 Financial Solutions
Carol Kennedy Excellence in Marketing & Communications
Cboe Global Markets
Annabelle Baldwin Excellence in Business Development SpiderRock
Arlene Klein Legal Eagle BlackRock
Amy Shelly Excellence in Risk Management OCC
Lilly Knight Excellence in Hedge Funds K2 Advisors
Wing Chan Excellence in Asset Management
Credit Suisse Asset Management
Alexandra Wilson-Elizondo Excellence in Fixed Income
MacKay Shields
Keisha Audain-Pressley Excellence in Compliance Pimco
Michele Hillery Excellence in Clearing DTCC
Samantha Stogsdill Excellence in Operations Clearpool
Arianne Criqui Excellence in Options
Cboe Global Markets
Erin Stanton Excellence in Data and Analytics Virtu
Casey Costanza Excellence in Trading Platforms Tradeweb
Peggy Sullivan Excellence in Service Providers Vela
Fran Kenck Excellence in Exchanges Tassat Group
Traci Creange Excellence in Trading
Mizuho Americas
Susan Estes Excellence in Treasury Trading
OpenDoor Securities
Sadia Halim Excellence in Banking BNP Paribas
Kelly Sanderson Excellence in Prime Brokerage BlackRock
Kelly Beatty Excellence in Fintech Worldpay, Inc.
Ying Cao Excellence in Fintech Barclays
Kate James Excellence in Fintech ChartIQ
Meena Jeenarian Excellence in Fintech Abacus
Jennifer Theiss Excellence in Fintech IHS Markit
Joyce Frost Legacy Award
Riverside Risk Advisors
Jacqueline Stone Trailblazer Credit Suisse
Kathryn Zhao Innovation in Quantitative Trading
Cantor Fitzgerald
Mariam Rafi Excellence in Regulation Citi
Carlee Milliken Excellence in Hedge Funds Citadel LLC
Melissa Hinmon Excellence in Trading
Glenmede Investment Management
Eden Simmer Excellence in Trading Pimco
Marty Willis CMO of the Year Nuveen
Laure Richmond CFO of the Year Instinet
Nichola Hunter CEO of the Year LiquidityEdge
Kristen Walters Leadership in Risk Management BlackRock
Doris Brophy Individual Achievement
Société Générale
Claudine Gallagher Crystal Ladder BNP Paribas
Amy Hudson Excellence in Leadership Credit Suisse
Andrea Lisher Woman of the Year
J.P. Morgan Asset Management
Barbara Byrne Lifetime Achievement  
Anya Boutov Rising Star
Beacon Platform
Elizabeth Campbell Rising Star
Citadel Securities
Beatriz Da Cunha Rising Star BlackRock
Caryn Freiberger Rising Star Citi
Jessica Gaffney Rising Star
Mizuho Americas
Lauren Goodwin Rising Star
New York Life Investments
Julie Hansen Rising Star
Chicago Trading Company
Imane Kabbaj Rising Star HSBC
Ali Lombardo Rising Star Marshall Wace
Estelle Merola Rising Star
Société Générale
Lauren Silberman Rising Star Credit Suisse
Wentai Xiao Rising Star
AllianceBernstein
Heather Wootten Rising Star Tradeweb

Schwab Set to Buy Rival TD Ameritrade

London, United Kingdom - September 29, 2018: Close-up shot of TD Ameritrade Mobile, LLC's popular app TD Ameritrade Mobile.

If you can’t beat them, join them.

As if the race to zero commissions charged by the major retail brokerages wasn’t enough to juice the market, reports of retail broker Charles Schwab buying rival TD Ameritrade have surfaced, as first reported by CNBC, citing a source.

The deal would create a mega-retail brokerage behemoth with upwards of $5.1 trillion in assets between the two – $3.8 trillion from Schwab and the balance from TD. The deal is expected to be announced soon, the source told CNBC.

“This would create a Goliath in Wealth Management,” Wells Fargo senior analyst Mike Mayo said in a note to clients on Thursday.

Shares of TD Ameritrade soared 15% on Thursday, on pace for its best day since September 2008. Schwab’s shares surged 8%, on pace for its best day since September 2015.

Schwab will pay $25 billion for TD Ameritrade, the Financial Times reported Thursday.

Schwab CEO Walter Bettinger has been designated to run the combined company, sources said. TD Ameritrade CEO and President Tim Hockey said in July he is leaving the brokerage in February of 2020.

Horizon Adds IS Strategy to Suite

VWAP and TWAP are fine for basic traders looking to execute orders electronically.

But for those more savvy traders, implementation shortfall (IS) are the way to go. And Horizon Software is looking to grab more of these sophisticated traders by building and offering its own IS strategy. As part of the IS rollout, the firm has also tweaked its existing strategies for optimum efficiency.

To hear Vincent Dumontoy, Global Head of Client Solutions and Services at Horizon explain it, the firm currently automates highly sophisticated trading strategies for the execution of large orders with the TWAP (Time-weighted average price), VWAP (Volume weighted average price) and POV (Percentage of Volume) algorithms that are currently available globally. These algorithms have been improved with the ability to automatically execute not only during the intra-day trading period but also during the opening and closing auctions to benefit from the most pricing opportunities.

The addition of the new IS algo looks to fill the void and aims at setting up two levels of spots and three levels of participation rate.

“The implementation of the new algo enables to adapt the participation rate to the spot evolution,” Dumontov said. “This new algo is even stronger with the choice to either define fixed levels of trading spots or follow the VWAP plus or minus a percentage along the execution.”

So, how does IS work exactly?

Implementation shortfall as the difference in return between a theoretical portfolio and the implemented portfolio. When deciding to buy or sell stocks during portfolio construction, a portfolio manager looks at the prevailing prices (decision prices). However, due to a number of factors, the execution prices may be different from the decision prices. This can result in returns that differ from the portfolio manager’s expectations – the shortfall.

Horizon’s strategy will increase the targeted participation rate when the stock price moves favorably and decrease it when the stock price moves adversely.

“We are delighted to offer these improved highly sophisticated algorithms and to see the array of benefits they will bring to our client base,” Dumontov said. “Apart from profit opportunities for the trader, algo-trading renders markets more liquid and trading more systematic. This new release of algorithms has been enriched so our clients can trade at the best possible prices with significant reduced human mistakes.”

Dumontoy added that the firm’s algorithms are offered on a single platform to embed custom algorithmic strategies and allow for maximum flexibility.

“We believe Horizon is uniquely positioned on the automated trading market by offering a very flexible algo framework that allows the traders to ‘trade their way’ or benefit from an advanced set of execution algorithms,” he said.

October Bond ETF Fund Flows Outpace Equity Inflows

Fall is for fixed-income fund inflows.

As the weather has cooled so has investor interest in equity-backed exchange-traded funds, with fixed-income ETFs attracting more than $14.7 billion during October compared to $10.9 billion for equity ETFs during the same time. Bond ETFs have now attracted nearly $130 billion year-to-date in 2019 —outpacing the previous record of $127BN in 2017.

According to Matthew Bartolini, Head of SPDR Americas Research at State Street Global Advisors, the gains in bond-backed funds stem from the fact ETF investors have been reluctant to express a risk-on view, which normally favors equities. Investor caution, he added, has pushed bond inflows over the last three months over the $14 billion level.

“While equity funds have had dour flow results, bonds have been breaking records,” Bartolini began. “After averaging more than $12 billion a month in 2019, nearly $130 billion has now gone into bond ETFs in 2019 – outpacing the previous record of $127 billion in 2017. With these inflows, assets are now firmly over $800 billion. If the next two months keep up 2019’s average flow gathering pace, US-listed bond ETF assets could surpass $850 billion by year’s end – with a realistic shot at surpassing the one trillion mark in 2020.”

Wow.

In looking at equities, ETFs backed by them attracted $10.9 billion in October, the lowest monthly total for the year. Furthermore, the $87 billion year-to-date is off 41% from last year’s pace. Bartolini said that these inflows come as investors have to tune out geopolitical noise and slower economic growth and despite this global equities still posted their 8th month of gains for 2019, and US stocks hit new highs.

“Equity investors celebrated the eighth month of global stock gains by allocating $10 billion to equity-focused ETFs and while a net inflow, this is the lowest monthly inflow total for the year,” Bartolini said. “Even with an average $74 billion of inflows for November and December8 months combined over the past five years, it is unlikely that equity ETFs will surpass $200 billion in 2019, breaking a two-year streak.”

And that’s not all. Bartolini added that not only will equity fund flows likely miss the $200 billion target, but they are also likely to have the lowest annual flow total over the past five years.

“There are two more months to go, but the average monthly flows for November over the past five years have been $33 billion, with December averaging $41 billion. If those averages are hit, which would be more than a 350% increase from the average monthly totals in 2019, the total full-year figure would be just $162 billion – half of what the record was back in 2017,” he said.

On the sector level, financials reversed course and led the pack, attracting over $1 billion in October. Real Estate continued to garner assets, attracting $733 million during the month while materials and health care saw the most outflows, shedding $598 million and $596 million, respectively.

Also, Emerging Market (EM) ETFs posted inflows for the second consecutive month, according to SSGA data, after having four consecutive months of outflows.

“So, it seems sentiment has turned a bit. But it hasn’t been a full-stop U-Turn, with an equal rush in of assets to offset the rush out EM has endured, as evidenced by the $5 billion of outflows over the past three months,” Bartolini said.

We're Enhancing Your Experience with Smart Technology

We've updated our Terms & Conditions and Privacy Policy to introduce AI tools that will personalize your content, improve our market analysis, and deliver more relevant insights.These changes take effect on Aug 25, 2025.
Your data remains protected—we're simply using smart technology to serve you better. [Review Full Terms] |[Review Privacy Policy] By continuing to use our services after Aug 25, 2025, you agree to these updates.

Close the CTA