Home Blog Page 501

Equities trading focus : TCA : Michael Richter

Michael Richter_IHS Markit

THE CHANGING FACE OF TCA.

Michael Richter_IHS MarkitMichael Richter, Executive Director, Trading Analytics at IHS Markit dissects the reality from the myth of multi-asset class TCA

There has been a lot of talk about multi-asset trading – how do you define it?

From an asset management perspective, it means trading asset classes such as equities, FX, fixed income and OTC derivatives. However, multi-asset trading has gained popularity as investment firms look at different opportunities to generate alpha and diversify portfolios. In turn, this has led to well-resourced firms creating centralised dealing desks to consolidate the execution function of these assets. All the large asset managers that I engage have done this, but it is also the case with many small to medium sized fund managers.

There are a number of reasons why firms are moving in this direction: it allows them to pool expert trading knowledge and experience in a dedicated trading team; it also allows them to take advantage of technological advances in the trading space and to centralise them, particularly in terms of trading platforms and the associated technology, which brings a lot more efficiency to the execution process. It is much easier to manage the trading process when risk management and governance functions are centralised, and this is particularly important from a MiFID II standpoint, where there is a much higher focus on investor protection and execution quality.

Is there a growing demand for a multi-asset TCA product?

Yes, there is a large demand for multi-asset TCA, and a lot of this is driven by MiFID II and the changes in best execution requirements. FX and equity TCA are now mature products within the TCA suite and people are familiar with what can be done on these asset classes. It’s the newer asset classes that are seeing the most demand, for example bonds, CDS and OTC derivatives. Investment firms still need to provide a proof of best execution across hard to value assets using either an in-house or vendor solution.

The data on these assets can be scarce, but we have an ability to provide prices on them. For efficiency, investment firms may want to use the same provider across assets, and as such, we are seeing a significant increase in demand.

Another driver of demand is that different areas of the business are more focused on best execution and the tools that allow the demonstration of a process; certainly in the last 2 to 3 years. For example, dealing desks are working in a more integrated way with compliance, and need the same (and sometimes different) sets of output to meet business needs.

What is the best way to build a product? What strategy do you pursue?

Data is the key to TCA, and there is no question about that. Without good quality data, the data analysis will be futile.

At IHS Markit, we have a wealth of pricing data which enables us to power our TCA offerings, especially for more illiquid OTC assets. We launched TCA for our equity products in 2004, followed by FX in 2009 and fixed income three years ago. More recently, we expanded our TCA coverage to include CDS, Loans & MMI and OTC derivatives. If you look at all these products, the first aspect we consider is the underlying benchmark data; given we have strong data to rely on, we can start adding the calculations on top of this. Simplified, TCA is just calculations run between two different data sets, and we are able to leverage our expertise across an array of asset classes.

We have also made a very conscious decision to make our offerings distinctly different in terms of the functionality and the benchmarks and metrics used. Each asset class has to be taken on its own merits, as they have unique market microstructures and nuances which have to be taken into account.

How is data analytics changing your TCA product and how has the quality improved?

Data quality has improved significantly over recent years. If you go back 15 years, orders would be placed over the phone, with no accurate timestamps, and very little transparency.

Today, multi-asset orders are feeding through electronic platforms, in some cases with millisecond timestamp precision. This has led to an improved set of execution data for TCA purposes. The buyside have also been good at pushing the sellside to provide the necessary data points to enable them to run the analytics they want to see. Transparency has improved greatly.

Analytics are becoming more sophisticated and the thirst to measure execution quality with new benchmarks and metrics is growing all the time. This is particularly prevalent in the newer asset classes people are starting to analyse.

A report by Aite last year predicts that as AI gains traction, there will be a delineation between losers and winners in the TCA provider space. Do you agree?

I think players in the TCA space who don’t acknowledge the part AI will play in TCA could potentially end up losing in the long run. I do think AI in the electronic trading space will create clear winners and losers. There will be less human interaction in the execution process as intelligence evolves. It’s inevitable.

AI does exist today for TCA; there are offerings that can look at an order from a pre-trade perspective and ascertain the optimal approach to execute, looking at historical data, patterns in momentum, liquidity, volatility, news stories, etc. The machine can make these decisions in seconds, whereas a human would have to spend a fair amount of time collating all this information. As times, data, technology and regulations change, so will TCA. AI will play a part in an intelligent, efficient execution process across all assets.

What future developments do you see?

I think there will be interesting developments and advancements in TCA across assets. As the data quality improves and transparency increases, if we do see the consolidated tape that we have been hearing about for a long time now, that will be a huge game changer. I would like to see all assets provide cutting edge analytics and actionable insight. This is certainly where IHS Markit wants to go, as it is a differentiating factor.

What are the challenges going forward?

For vendors, one of the biggest challenges is differentiating yourself within a crowded marketplace. It’s about knowing what you provide that your competitor can’t, and thinking 3 or 4 steps ahead. It’s also about developing new and fresh functionality, so you don’t just fall into the crowd.

TCA solutions have to provide flexibility as new regulatory changes are a constant consideration. When building out new functionality and making developments this has to be kept constantly in mind. Data plays a key part, as you are looking to build out TCA in new areas, but acquiring data is going to be a big challenge in the TCA space as a whole.

Technological advancements have to be taken into account as well, and consideration needs to be paid on how your product can complement these advancements. Overall, it’s a very exciting and interesting place to be right now as the landscape is ever evolving.

©Best Execution 2019
[divider_to_top]

Equities trading focus : Equity derivatives : Russell Dinnage

TECHNOLOGY IS KEY.

Russell Dinnage, Head of the Capital Markets Intelligence Practice at GreySpark Partners

In 2019, equities Delta One derivatives trading desks are becoming increasingly prevalent, stand-alone lines of business within Tier I and Tier II investment bank equities trading franchises. The reason: Delta One trading is fundamentally a fees-driven business linked to products structuring, issuance, price-making, OTC trading and on-exchange market-making in which related services such as dividend trading, equity financing and equity index arbitrage can be easily linked.

The past decade has seen sellside equities trading franchises suffer due to post-financial crisis declines in volatility and ongoing implementation of US and European regulatory regimes. This has led to bank retrenchment from universal coverage of all equities trading services and the increasing focus of buyside investors on accessing liquidity in passively-traded instruments. However, one bright light remains equities Delta One derivatives trading which is still a profitable enterprise for those institutions technically proficient enough to construct economies of scale.

While sellside equities Delta One desks are in a period of ascendancy in 2019, they are also in a period of transition. Existing in-house technology components are approaching the end of their functional lifecycle, which was repeatedly extended at significant cost to operators. During the lifespan of these systems, the vendor landscape of equities Delta One derivatives systems changed significantly, which – in turn – influences the technology options and choices for sellside franchise operators.

Our understanding of the significant challenges and changes facing leading sellside equities Delta One derivatives trading desks is borne out by the findings of an analysis of 10 such leading franchises. The top-line findings of this analysis are three-fold:

  • Average Age of Platforms – At an average age of 10 years, trading platforms within the assessed bank franchises are well outside nominal legacy limits for front-office technology;
  • Average Spend on Platforms – Inclusive of nominal operational running costs and – in specific instances – necessary, vendor-provided bolt-ons, average platform spend per franchise is USD 17m. This relatively high level of cost is due in part to the challenges associated with maintaining no longer fit-for-purpose legacy systems by augmenting or altering functionality in response to changes in the characteristics of the bank franchise or client base; and
  • Imminence of Replacement Decisions – 7 out of 10 of the assessed banks are set to make ‘buy or build’ decisions in the context of legacy system replacement within the next two to three years.

These top-level findings from a diversified sample of sellside equities Delta One derivatives programme trading built-and-bought platforms is indicative of the simple reality that the first generation of automated trading solutions were built in-house and continue to form the core backbone of these franchises in a relatively unreconstituted manner. GreySpark found that the overwhelming majority – 80% – of assessed Tier I sellside cash equities and equities derivatives businesses operate in-house built programme trading and Delta One platforms separately from one another.

Assessing the attributes of ‘Built & Bought’

For Tier I bank technology decision-makers and purchasers, the question thus becomes: What key functionalities of sellside built and bought programme trading platforms allow for the expression of competitive differentiation within the confines of equities Delta One derivatives trading and market-making on a bank franchise-by-bank franchise basis?

To answer this question, strategists and decision-makers must look past those functional areas in which vendor-provided solutions – acting as core, underlying technology or as a strategic bolt-on to an in-house built platform – perform well across the board. Rather, the answer lies in those areas in which vendor solutions typically remain deficient in 2019. Driving competitive differentiation forward furthermore requires an understanding of the reasons why vendor solutions remain deficient in particular functional areas.

In 2019, there are three programme trading vendor solutions for equities Delta One derivatives trading that, in GreySpark’s assessment, perform well from a Tier I or Tier II bank requirements perspective in meeting core, commoditised functions. Compared to bank users’ ideal states, which are represented by the highest possible score, collectively, the strengths of the three vendor solutions lie primarily in the at-trade areas ranging from basket pricing to trading and order/trade performance benchmarking. However, functionality across the three solutions is limited within the areas of pre-trade and post-trade analytics.

For Tier I banks, these analytics can and should be a focal area of competitive differentiation. Those banks – with a large footprint across geographies, asset classes, instruments and client segments – are the largest repositories of client, pricing and trade data. In order to take advantage of their knowledge asymmetry vis-à-vis other market participants, they must undertake the challenging task of corralling, analysing and ultimately acting on the insights within their vast data store. Fortunately for global Tier I banks, the regulatory challenges associated with the EU’s European Markets Infrastructure Regulations (EMIR) and revised MiFID II should facilitate the utilisation of their bank data. Both regulations require banks to create golden source data repositories and map their data inventories and flows in order to efficiently comply with the mandates of the regulations.

Equities Delta One derivatives trading vendor solutions targeted at Tier I and Tier II banks perform more variably in non-functional attributes than in the functional areas assessed. Although the vendor offerings, on average, display strong degrees of flexibility and resilience – and the quality of support offered by each vendor was also rated as meeting Tier II bank requirements at a minimum – other key criteria are underserved. Specifically, the extensibility, performance and latency requirements and – crucially – scalability of the three un-augmented solutions were assessed as being inadequate in meeting the needs of Tier I equities Delta One derivatives programme trading franchises.

Assessing the necessary architecture & technology

Investigating the profile of vendor technology offerings for programme trading associated with equities Delta One derivatives against the needs of Tier I and Tier II bank franchises in the areas of trading and market-making, in particular, illuminates and categorises functional areas into commoditised areas versus those in which competitive differentiation opportunities remain. The findings for 11 particular capabilities uniquely relevant to Tier I and Tier II investment bank franchises, clearly distinguish:

Commoditised Functions – In 2019, FIX List and basket trading functionality – specifically, order aggregation, wave trading and benchmarking – including the ability to manage multiple baskets with multiple accounts for global execution from one front-end system are no longer points of competitive differentiation among the three assessed solutions. The same is true of the management of multi-region baskets within a global distributed deployment and the ability of vendor solutions to provide traders with market-, region- and sector-based filtering of the products or instruments available to trade as well as order aggregation, wave trading and trade and order benchmarking.

Competitive Differentiators – The sophisticated use of bank data lies at the core of those functions currently underdeveloped in vendor software. Whether required as part of liquidity sourcing in the form of identifying crossing opportunities arising internally from the bank’s own client liquidity, as part of analytic functions such as pre- and post-trade reporting on execution quality or in performing pre-trade allocation, analytic capability that relies on bank data remains an operational pain point for Tier I and Tier II franchises using vendor technology for programmatic trading associated with equities Delta One derivatives trading, providing opportunity for competitive differentiation.

A granular analysis of 9 characteristics relevant for the trading architecture and technology of the three assessed vendor solutions targeted at Tier I and Tier II sellside equities Delta One derivatives trading and market-making franchises demonstrates that there are areas of commoditisation and competitive differentiation, as there were in the analysis of trading capabilities shows:

Commoditised Characteristics – Multi-hub architecture support as well as high availability and disaster recovery are largely commoditised among vendor solution. The same is true of integration and API availability – where these support the integration of bank-proprietary trading algorithms – and audit trails, albeit to a somewhat lower level.

Competitive Differentiators – Volume remains an area wherein banks can move out of the pack and differentiate themselves from their competitors as scalability, throughput and end-of-day downtown requirements leave significant room for improvement. Furthermore, extensibility of vendor-based systems remains sub-standard, a likely reason that analytics driven by bank data also fall short of Tier I and Tier II franchise requirements and remain competitive differentiators among the trade functionality capabilities outlined above.

An end to the ‘Buy vs. Build’ debate

GreySpark believes that – for those banks seeking to defend, restart or grow anew Delta One derivatives trading franchises in 2019, the era of equivocation regarding ‘buy versus build’ decision-making is at an end. In short, ‘buy’ has won – even for the largest Tier I universal banks – and the only questions that remain in 2019 surround: ‘Which system?’; ‘Under what conditions?’; ‘With what functional capabilities?’; and ‘When?’

©Best Execution 2019
[divider_to_top]

Equities trading focus : Donna Nemer & Merlin Rajah : JSE

Donna Nemer

MAKING TRADING RELEVANT IN EMERGING MARKETS.

D.Nemer-M.Rajah-JSEDonna Nemer, JSE Director of Capital Markets and Group Strategy and Merlin Rajah, JSE Senior Technical Account Manager: Equities & Equity Derivatives

There have been significant advancements in emerging market exchanges, that have increased investment to enhance technology, order execution, market structure, and in so doing, liquidity. New order functionality, along with broader suites of data, low-latency offerings, as well as enhanced trading, clearing and risk systems are just some of the mechanisms intended to provide faster and more transparent information to investors and their clients.

The Johannesburg Stock Exchange (JSE) offers multi-asset class, fully electronic, secure trading with internationally recognised and awarded regulation, trading and clearing systems, settlement assurance and risk management. As part of its growth journey, the JSE implemented an electronic trading platform for government bonds in 2018, which made use of the MTS system operated out of Milan. This allowed for central automation as well as increased transparency in the local debt markets. In early 2019, the JSE will go live with its equity and currency derivatives markets on the Millennium trading platform, which is also the technology system used to operate the cash equities market.

The rest of the African continent is also witnessing ongoing investment to deploy advancements in trading technology. For example, the Nigerian Stock Exchange announced in December 2018 that they will continue to leverage Nasdaq’s matching engine technology for its equities and fixed income markets for another five years, while, in 2017, the Nairobi Stock Exchange issued its first-ever government bond that could be traded exclusively on a mobile phone. A year later it unveiled its mobile app, which provides investors with real-time financial market data, financial analysis and the ability to invest with virtual money. However, the lack of liquidity and activity in some of these markets make it difficult to support a compelling case given the lack of scalability.

Another challenge is that of the adoption of MiFID II. While developed markets are accommodative, the requirements under this legislative framework have not been formally adopted by all emerging markets. This is no surprise as emerging markets are historically policy-takers. The changes that have been implemented cater for sets of regulation across the board and are driven by the large international asset management and sellside firms who are seeking to achieve unified best practice.

One key difference between very large liquid markets and emerging markets is the definition of ‘best execution’. In many emerging markets, there is either a single exchange or one very dominant player. This means the best quality of liquidity will be found on these main exchanges, where the largest number of diversified buyers and sellers reside, as is the case in South Africa, at the JSE. Market participants in emerging markets are increasingly embracing the benefits of ‘best execution’ but given the structural constraints, regulators will most likely allow the market and its participants to evolve, rather than enforcing all trading participants to connect to multiple exchanges for best execution.

As to the unbundling of research and execution under MiFID II, the brokerage and execution providers have become much more competitive. In emerging markets, a subset of listed shares typically dominates trade and market activity. These stocks attract the interest of analysts and research teams whereas small and mid-cap stocks are generally not as well covered and are seen as less attractive given the higher liquidity risk in these countries.

Looking ahead, there is an expectation that emerging markets will continue outperforming many of the larger developed markets especially as China builds dominance. Stronger risk adjusted returns will also make them an attractive asset class. As a result, index providers are helping drive this awareness as they develop new and bespoke indices and products for exchange traded fund (ETF) issuers to cater for demand. These dynamics supports the case to continually deepen trading functionality, market quality and liquidity to grow emerging markets.

©Best Execution 2019
[divider_to_top]

Equities trading focus : VWAP : Chris Sparrow : LiquidMetrix

Chris Sparrow-Liquidmetrix

EXPLAINING VWAP PERFORMANCE – ATTRIBUTION OF PERFORMANCE.

Chris Sparrow-LiquidmetrixChris Sparrow, Head of Research at LiquidMetrix

The VWAP algorithm (algo) is used heavily by many traders. As a result, there is a lot of interest in understanding why specific results were obtained, as well as the quality of those results. In this article we present a way of explaining the performance that an order had versus a VWAP benchmark. While other strategies could be analysed in similar manners, what we present here is specific to VWAP strategies.

We apply a TCA framework with additional scenario analysis to attribute the realised performance of an order traded via a VWAP algo. Our goal is not only to find what the performance was, but why we got the results we did, and how it can be improved in the future.

Questions

A good analysis will answer relevant questions that can help achieve business objectives. In this case the following are our questions related to VWAP performance:

  • Was our performance good or bad?
  • Why did we have the performance we had?
  • What would our performance have been if we traded differently?
  • What impact did various types of liquidity have on our performance?

Analysis

Now that we know the questions, we need to develop a way of analysing the data to provide these answers.

For VWAP strategies there are some key distributions that will help us understand why the price we achieved for our order differs from a VWAP benchmark. We first define the volume-price distribution by summing all volume that occurs at each unique price during the time the order was being worked. For illustration purposes, see Figure 1 below which shows some sample data. The volume is shown on the y-axis and is the total traded volume at a given price – summed over possibly many fills. The x-axis shows the price. If we use all the fills from the market, the distribution can be interpreted as the opportunity set that a trader had in interacting with the market. The average of the market volume-price distribution shown below is precisely our VWAP benchmark.

However, we get something more when we show the distribution, which is how wide the distribution is. If all the volume occurred at one price, the distribution would be very thin, while volume that trades at many prices will be wider. It is easy to be close to a VWAP benchmark when the distribution is thin, and much harder to match the VWAP when the distribution is wide, so we can use the width of the market volume-price distribution as a difficulty factor. We can think of this width as the intra-order volatility. If volume only trades at a single price during the order, the volatility would be zero, while if it trades in a large range of prices, the volatility would be high. You can’t miss the VWAP if all the volume trades at one price, but it is hard to match exactly when the volume is spread out widely.


Was our performance good or bad?

We can now answer the first question: An order that has a small ratio of the performance in price divided by the intra-order volatility has good performance while an order with a large negative ratio had poor performance.

We can take it a step further and compute the precise range of possible outcomes that an order of the size of our order could have obtained given the total volume traded during the lifetime of the order.

This involves computing the lowest average price by summing up value from left to right until we use all the order volume and then dividing this value by the volume of the order. This is the lowest price an order the same size as our order could have achieved.

If our size was 100%, we would get back the VWAP. We do this again going the other way to get the highest possible price an order the same size as our order could have got.

The result is a precise range of outcomes – the lowest and highest prices we could have achieved – that we can use to normalise the difficulty of an order being benchmarked to VWAP. We can represent this graphically by showing these numbers as a gauge in Figure 3.

Why did I have the performance I had?

We can begin addressing our next question by comparing the normalised order and market volume-price distributions.

For illustration purposes, assume we are a buyer. Then we can see where we traded at relatively more or less than the market volume at each price.

As a buyer, we hope to get more volume at low prices than at high prices. The volume-price distribution shows us the relative differences in each price between what we realised and what was traded in aggregate by the market.

It enables us to see which prices we didn’t trade as much volume as we should have and which prices we traded more volume than we should have, based on what traded in the market.

The key is to normalise both distributions so we can observe the percentage of volume of our order versus the percentage of total market volume during the period we were working the order.

If we can trade a constant fraction of all market volume, then our average price would, by definition, match the VWAP.

What would my performance have been if I traded differently?

When we are trading VWAP order, we will often try to match another distribution: the volume-time distribution. Often a VWAP algo will use some combination of historical volume and a volume prediction model to generate a schedule of desired volume. The VWAP algo’s strategy is to match the time-volume of the market and to trade at similar prices. We can measure the sensitivity to the time-volume distribution by comparing it with the order’s time-volume distribution. Figure 4 shows these two distributions where the fraction of volume is binned into 30-minute increments along with the volume-weighted average price for each bin (value traded / volume).

The first thing to realise is that the average price of the order is the sum of the fractional volume multiplied by the value for each bin. The same is true for the market with the outcome being the benchmark, i.e. the VWAP. This is because we normalised the volume.

Now we can compute what the average price of the order would have been if we had the same prices in each bin but instead of achieving the volume-time distribution we instead matched the market time-volume distribution exactly. This tells us how much of our performance deviation from the market VWAP was caused by missing the market volume-time distribution.

We can do a similar calculation to find out how the trading results we had in each bin affected our performance by computing the average price using the order’s time-volume distribution but replacing the average price we got in each bin with the average price from all market volume. Now we know what drove our performance deviations.

What impact did various types of liquidity have on my performance?

To answer this question, we can filter liquidity and recompute the performance. For example, when we look at the individual market trades, we may notice that there are some large block trades. We may want to remove these trades to see what their impact was on the benchmark and how our other performance analytics would change as a result. We could do something similar by either removing or adding certain venues. If we have specified to avoid trading at a specific venue we can re-compute the VWAP benchmark after removing all the trades from that venue. Another example may be to remove odd-lots.

By comparing the performance benchmarks with and without the liquidity we are assessing, we can answer the question of how specific types of liquidity impacted our results. We can then use this information to decide to change our tactics to generate better results.

Conclusion

Many traders still use VWAP algos and are interested in understanding why they got the results they got, whether those results were good or bad, and what actions they can take to try to get better performance.

We have built a framework to allow this analysis given a set of client order data which is analysed by comparing market data. Traders can now visualise and fully attribute performance on individual VWAP orders.

©Best Execution 2019
[divider_to_top]

Equities trading focus : SIX Swiss Exchange : Adam Matuszewski

Adam Matuszewki
Adam Matuszewki

BUILDING BLOCKS WITH A ‘PLUS’.

SIX-Alex MatuszewskiAdam Matuszewski, Equities, SIX

If you squeeze a half-inflated balloon on one side, the other side will expand – when you release the balloon, it rebounds. Something similar is happening to equity trading markets in Europe.

MiFID II introduced double volume caps (DVCs) to limit non-displayed trading in Europe. The expectation was that volumes would shift to lit markets. The result? Market participants’ needs remain unchanged. Today the call for non-displayed trading facilities that minimise the market impact of their transactions remains stronger than ever. As a result, market operators have rushed to offer their members alternatives to dark trading which are unconstrained by regulation.

When the first DVCs expired after 6 months in September 2018, liquidity instantaneously returned to dark pools. One trend that did not reverse, but rather increased, was the systematic surge in the average trade size across non-displayed pools. The main driver behind the rise of both dark and block trading volumes is user demand. For both buyside and sellside clients, block trading is a critical enabler. With SwissAtMid, the Swiss stock exchange has created an innovative solution that caters to the needs of its participants and introduced functionalities that make trading smarter and easier.

SwissAtMid takes off

Fully conscious that market participants are concerned about information leakage and price slippage during the trade execution process, SIX developed SwissAtMid, providing users with a non-displayed pool of liquidity. SwissAtMid also offers more competitive pricing on blue chips as well as small-to-mid cap firms listed on SIX. For instance, the average price improvement in Q1 2019 stood at four basis points (bps). Since launch, SwissAtMid has enjoyed exponential growth, and is now the largest source of non-displayed liquidity for Swiss equities, capturing around 38% of dark market share, which is three times more than its nearest competitor.

The growth of block liquidity

The actual value-add of block trading has helped boost its appeal among institutions. Firstly, it can facilitate quick execution of large orders at competitive pricing while maximising liquidity capture and reducing market impact, thereby helping to augment performance. As sizeable transactions are conducted between two counterparties away from pre-trade transparent books, orders are more likely to match against natural liquidity.

The increased block liquidity on SwissAtMid is mostly down to the large execution orders it receives from the country’s extensive network of private banking institutions along with investment banks, a number of whom utilise dark liquidity-seeking algorithms. Furthermore, the proprietary data of SIX also indicates that LIS liquidity volumes surpassed that of sub-LIS, and this trend is expected to continue.

In addition, analysis by SIX found that when LIS executions in Swiss shares occur on other dark or periodic auction venues, SwissAtMid offers block liquidity in that particular share roughly 25% of the time. Most significantly, this liquidity remains in place even after the trade has been executed on other venues, which indicates a considerable amount of unique flow in SwissAtMid for market participants to interact with. In contrast, liquidity on most public venues will frequently dry up after a large order has been completed. The clear liquidity advantages available on SwissAtMid are mainly attributable to the fact that it is the preferred dark venue to which the country’s private banks are connected to.

Limit Plus and Iceberg Plus

LIS liquidity has been improved further through the roll-out of two orders – Limit Plus and Iceberg Plus. Limit Plus allows end users to place resting orders into the lit order book of SIX and at SwissAtMid concurrently. This means the order has full visibility in the lit order book, but it is also available for execution on SwissAtMid. Through this dual exposure, the likelihood that participants will successfully execute their trades increases significantly.

This structure in particular benefits firms utilising VWAP (volume weighted average price) algorithms, which seek to execute trades at prices below the daily trading average, by following the historical volume curve, combining spread capture and cross logic. As orders on Limit Plus sit at the best price in the lit book while simultaneously benefiting from the liquidity available at the midpoint on SwissAtMid, it helps participants capture more volume and avoid spread crossing which may harm performance against the benchmark.

Iceberg orders are becoming more ubiquitous too, accounting for 3% of all equity trades with an average order size exceeding CHF250,000. However, the trend this year indicates that more of these Iceberg orders will be submitted as Iceberg Plus. This is an enhancement of the existing Iceberg order whereby the visible tranche is pegged to the bid/offer while the full quantity is also available to trade in SwissAtMid. These orders will help facilitate block executions and speed up the time it takes to fill orders. That is particularly true for instruments where liquidity is scarce.


www.six-group.com/exchanges

[divider_to_top]

Analysis : Equity markets in Europe : Spring 2019

LiquidMetrix analyses consolidated performance figures for equities and ETFs traded in Europe in the previous quarter.

The charts and figures below are based upon LiquidMetrix’s unique benchmarking methodology that provides accurate measurements of trends in market movements. We have seen many changes in market microstructure over the last year, and here we present statistics based upon Q1 2019 market data to provide some insights on current trends.

To give an overall indication of the market in the first quarter of 2019, we again compare the Value Traded in Europe against the % Traded LIS. We can see in Q1 a continuing upward trend, and a significant increase in March despite Brexit uncertainty, but a fairly flat Total Value Traded.

One criteria to assess Venue quality is the % of times the Venue has a Best Price in the market. This is a measure of how competitive the Lit markets are as it is based upon the major index constituents of each market, and includes both price ties and unique best price.

The Lit markets have altered characteristics compared against the previous quarter, with Aquis now ranked second on DAX, SMI, MIB and OMX-S and third on FTSE and CAC Best Price % having replaced Chi-X on its previous second place ranking. The % Best Price increased across most markets during the quarter apart from the FTSE.

The Market liquidity picture has continued the trend from the previous quarter, with a lot less liquidity being made available on Lit Venues in the last quarter of 2018.

Taking a 10 basis point measure from the mid price, we can see that liquidity dramatically reduced on the FTSE, CAC, DAX, SMI and OMS-S with only the MIB seeing an increase. All MTFs had corresponding reductions/increases in the same direction as the Primary Venues.

The tables below give one method of how to assess performance of Dark Pools in Europe. For trades in each major index constituent stock we review the value traded during the period, the average trade size and the relative impact on the lit market using as a measure the % of times there is a corresponding movement on the lit market.

We can observe that there are different characteristics across the various market centres.

The value traded on FTSE increased in Q1 2019 when compared with the previous quarter, but reduced on all the other markets.

For Q1 2019, we observed that XUBS increased its share of the Dark flow in FTSE and MIB up to a 3rd place rank. XPOS reduced market share on several markets including FTSE, DAX, SMI and MIB.

Using the same methodology we assess performance of Periodic Auction Venues together. Ranking by Value traded, the clear leader over the period is Bats Periodic Pool, BATP.

SGMY moved to third rank on SMI with Aquis AQXA gaining market share (although with a much smaller average trade size). There was a dramatic reduction for XPOS on DAX, with SGMY and TRQA gaining over the period. On % Price Move correlation SGMY continues to have excellent performance with figures of less than 10% on SMI, MIB and OMX-S.

ISS LiquidMetrix are pioneers in the measurement of European Fragmented markets, and provide research,TCA best execution and Surveillance for financial market participants and regulators – www.liquidmetrix.com

©BestExecution 2019

[divider_to_top]


CEO Chat: Joe Wald, Clearpool

Markets Media recently caught up with Joe Wald, CEO and a Founder at Clearpool Group, to discuss the need for securities brokers to differentiate.

What does differentiation mean for securities brokers? What are the key factors?

Joe Wald, Clearpool

Brokers can differentiate themselves by reinforcing the trust they already have with their clients and utilizing technology, like an Algorithmic Management System, to take it a step further. The keys to differentiation are first and foremost their ability to articulate what steps they’ve taken to create unique value, and then their ability to demonstrate the performance results.

How can brokers achieve differentiation in today’s market?

It takes an investment in personnel, technology and time to understand how to fully utilize technology for their clients’ benefit. Ultimately, brokers have excelled in their service models in the past—using technology is just a natural extension of that and gives them tools they can employ to provide a customer-centric solution for each and every client. With regard to best execution, a one-size-fits-all algorithm doesn’t work. Brokers need a service model with people who can utilize technology and work with their clients to create custom algorithms that align with the goals of each of their buy side clients.

Brokers have done a phenomenal job servicing their clients and building trusted relationships, but they’ve been handicapped by not having the right tools as the market has evolved. Now that the right tools exist, brokers can have the transparency and analytics they need to properly align themselves with the goals of each of their buy-side clients.

How is differentiation today different than it was in the past?

The biggest difference is that today’s differentiation is technologically empowered. In the past, brokers were very capable of talking about what was happening in the overall market and in their specific sectors, from fundamental and news-flow perspectives. But as electronic trading took hold, there was more fragmentation, and the microstructure became more complicated and opaque. They did not have tools with the level of analytics necessary to be able to convey to their clients what was happening with their trades. Being able to provide that level of detail is absolutely necessary for clients to achieve their execution goals given the complex microstructure that we have today.

How are buy-side firms looking for brokers to differentiate their services?

The buy side is looking for more transparency and control from their executing brokers. Ultimately the buy side needs their brokers to be completely transparent and provide them with transparency into what’s happening with their orders in the marketplace. Brokers need to provide a level of service to their clients that allows them to adjust algorithms and routing tables on a client-by-client basis in real time. They need to be able to configure and control the ways that their client’s execution protocols work to achieve the results that they’re looking for.

What are the rewards of differentiating — and the costs of not differentiating?

The rewards are clear: continued and enhanced trust in the relationship, and tremendous relevance as a partner. A key point is that the band is really wide between the minimum and the maximum level of service that a broker can provide and the value they can demonstrate to the buy side. So brokers have the opportunity to leverage and embrace technology and to extract the maximum value out of their client relationships, rather than only getting the minimum of their clients’ potential value because they’re only paying them what they think they absolutely have to.

The buy side has a limited wallet to pay for services. They are going to pay for the things they value, and they won’t pay more than they need to for anything unless they see somebody really go above and beyond and demonstrate true value. Execution quality has become a critical factor in getting people to move their wallet and the tools that exist today give brokers a way to show how they are helping improve that client’s execution quality.

What does the future hold for differentiation in institutional algorithmic trading?

Differentiation comes with the responsibility of taking ownership and empowering yourself by adopting and embracing technology. The winners will be the ones who take ownership and leverage technology to their advantage—the ones who get into the details of microstructure and how they use their knowledge to proactively make recommendations that improve their clients’ trading strategies—and the losers will be the ones who remain stagnant and entrenched in the status quo.

Thinly Traded ETFs Trade Differently Than Liquid ETFs

Nasdaq’s Phil Mackintosh recently examined a single chart that combines many of the things he’s recently been discussing regarding market fragmentation, routing, spreads and ETF liquidity.

What he found is just how differently popular ETFs trade versus thinly-traded ETFs.

Smaller ETFs trade differently than large ETFs

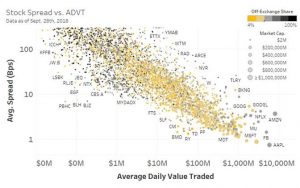
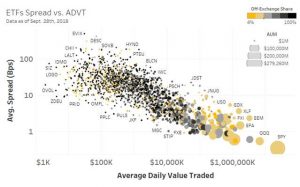
In Chart 1 (see below), each circle represents an ETF ticker. Note that the biggest ETFs (big circles) also see the most trading (in the bottom right corner). That in turn results in the most competitive, and tightest spreads (low on the vertical axis). So far no surprises for regular readers of our posts.

However, where this chart gets interesting is the color scheme. Yellow circles represent stocks that trade on-exchange more than the market wide average. While the darker the circles get, the higher the proportion of trading that occurs off-exchange.

What that highlights is that for many thinly traded ETFs, the proportion of trading off-exchange is very high. There are a couple of good reasons for this.

First, the underlying investors are different. Hyper-liquid ETFs are frequently used by hedge funds and banks to hedge and take tactical positions. That’s why their turnover often looks more like a future than a stock. This in turn creates economies of scale for market-makers and arbitrageurs, even leading to tighter quotes and more tactical trading.

In fact, their spreads become so tight that they are usually much cheaper to trade than the underlying stocks.

In contrast, many of the smaller ETFs are designed for longer-term investors with active or smart beta portfolios. That in turn makes them more popular with retail and investment advisors. As we noted recently, advisors and retail investors tend to trade much more off-exchange.

We’d prefer to see tighter spreads on exchange and made some proposals to deliver this in our ETF Rule Comment. But until that happens, off-exchange trading of thinly traded ETFs can often help reduce trading costs, as we discuss below.

Chart 1: As ETF popularity increases, spreads fall and exchange trading increases
stock_spread

etf_spreads

Source: Nasdaq Economic Research

Don’t be scared by ETFs with wider spreads and low ADVT

One of the unique things about ETFs is that market-makers can buy the ETF or buy the basket and do a creation. That’s important because it means, for larger trades:

ETF daily volume is NOT important, as arbitrageurs and market makers can pull liquidity from the underlying stocks into any ETF. That means most ETFs can easily absorb trades of at least $100m, which (for perspective) is roughly the market-wide value on offer in the U.S. market at any time during the day
ETF spreads should NOT deter investors from considering larger trades in an ETF, as market makers can buy the underlying stocks and convert that cost to an ETF
However, by definition, when you trade through a market maker you contribute to increased “off-exchange” trading.

Even if your trade is small, crossing the ETF spread is usually still cheaper than buying the basket of underlying stocks. In fact our data shows that more than 99.4% of ETF liquidity (by U.S. dollar value) trades with spreads less than 20bps.

Bonus Chart: What about Stocks?

In case you’re wondering what this looks like for stocks, we’ve added that chart below too.

What we see is interesting: stocks trade more “the same” with many stocks being a pale shade of yellow (slightly more lit trading than the market-wide average). Although we do still see spreads are tighter as daily increases (diagonal slope of the line).

Thinly traded stocks (left side of chart) do tend to trade more dark, the pattern is nowhere near as strong as for ETFs—nor does it start at the same point:

ETFs trading less than $20 million/day tend to commonly trade a high percentage off-exchange
While stocks trading less than $1 million/day sometimes trade a little more off-exchange than average
One factor that is likely contributing to both stocks and ETFs is that retail internalization is a higher proportion of trading in smaller-cap securities.

Chart 2: The same chart looks very difference for corporate securities

etf_spreads

More from Economic Research

Three Charts that dispel the Price Improvement Myth

The views and opinions expressed herein are the views and opinions of the author and do not necessarily reflect those of Nasdaq, Inc.

Use of Machine Learning Becomes the New Norm

Design made of human head and symbolic elements to serve as backdrop for projects related to human mind, consciousness, imagination, science and creativity

Refinitiv announced new research findings that confirm the use of machine learning is pervasive across the financial community and is critical to its success in the future. Ninety percent of the c-level executives and data scientists surveyed have already deployed machine learning, while all of the c-level participants said it is core to their business strategy.

However, respondents acknowledge that poor-quality data impedes their ability to fully leverage machine learning and artificial-intelligence technology, with 43% citing this as the biggest barrier to adoption followed by a lack of data availability (38%). Despite being a technology area that’s seen a recent ‘war for talent,’ challenges around data quality were ranked ahead of access to talent, which was highlighted by a third of the respondents.

This information was compiled for the inaugural Artificial Intelligence/Machine Learning (AI/ML) Survey by Refinitiv, featuring in-depth interviews of nearly 450 financial professionals across North America, Europe and Asia. Its findings confirm how far the industry has evolved since 2017 research that indicated technology companies were the primary adopters of artificial intelligence (AI) and only 28% of financial-services firms were deploying it. [1]

Key findings from Refinitiv’s new research include:

90% of financial firms are using machine learning, either in multiple areas as a core part of their business (46%) or in pockets (44%); the 10% of firms that have not yet deployed machine learning are experimenting with it
75% of firms are making significant investments in machine learning
62% of c-suite respondents plan to hire more data scientists in the future as banks and asset managers seek to give themselves a data and technology edge over competitors
The main applications for using machine learning were in risk management (82% of respondents), followed by performance analytics and reporting (74%), with alpha generation in third place (63%)
AI/ML adoption is primarily driven by extracting better quality information (60%), increased productivity and speed (48%), and cost reduction (46%)
“Machine learning and artificial intelligence are often described as emerging technologies, but the fact is they are already being widely applied across financial services,” said Tim Baker, global head of Applied Innovation at Refinitiv. “Whether it is an increasingly complex regulatory environment, the need to find new sources of alpha, or winning the fight against financial crime, the industry is turning to data and technology, and data scientists are increasingly important as the alchemists charged with turning big data into insight.

“We see a future of accelerating innovation fueled by wider availability of powerful cloud-based artificial intelligence and machine learning tools dramatically lowering entry barriers and thus changing the competitive dynamic across the industry. But no financial institution will be able to use the technology successfully unless the underlying data is machine ready.”

Learn more about the Refinitiv AI/ML survey.

CANNABIS CORNER: Where Have You Gone Cheech and Chong?

One thing for sure, it isn’t just stoners like Cheech and Chong any more. And these new users and those non-users embracing legal cannabis are driving the market are spread wide and far across the demographic spectrum, according to new research from Quinn Thomas and DHM.

As noted in a recent commentary from DataTrek, co-founder Jessica Rabe thought it was important to examine just who is driving the push for cannabis legalization and dispel notions that marijuana isn’t just for movie stoners or older hippies.

The Quinn Thomas/DHM research sampled 900 marijuana users in Colorado, Washington and Oregon and also conducted two focus groups in Portland and Seattle. They chose those three states because Colorado was the first to allow recreational sales over five years ago, followed by Washington and Oregon, so they have the longest track records. Their research also notes that “Oregon has the highest percentage of monthly cannabis consumption in the country among its adult population – 20%”.

Let’s take a look.

Cannabis User Demographics:

Gender: Male (60%), Female (40%)
Age: 22-34 (30%), 35-54 (+35%), 55+ (35%)
Household Income: Less than $25k (24%), $25-50k (23%), $50-75k (19%), $75-100k (14%), $100-150k (14%), Over $150k (6%)
Relationship Status: Single (33%), Married (51%), Cohabiting with long-term partner (11%)
Party: Democrat (35%), Republican (26%), Independent (32%), Other (7%)
Education: Less than high school (30%), Some college/2-year degree (33%), College (19%), Graduate degree (16%)
Rent or Own: Rent (32%), Own (60%), Something else (8%)
“It is a population that has much more in common with a typical middle-class resident than with the caricatures created in Hollywood movies,” noted DataTrek’s Rabe.

Users generally match the U.S. average educational attainment, household income levels, and the political composition and race and ethnicity breakdown of the three states researched, noted the survey. This includes everyone from young-single renters to middle-age homeowners with kids to retired seniors.

Rabe added that there were two caveats to this: First, men consume marijuana more than women. Secondly, frequent users cluster at the lower end of the income scale. For example, 35% of regular users (who consume almost daily) have household gross incomes of under $25k per year compared to 11% of infrequent users.

So, do users drink along with their smoke?

The survey found that 38% of respondents drink less when they canna-indulge, 58% drink the same amount and only 4% drink more. And of this group, 24% said that they replace alcoholic beverages with cannabis.

“Over one-third of marijuana users drinking less post-legalization is a significant stat, especially since that’s across the board in terms of frequency of use,” Rabe noted. “Of course, it’s truest for regular users (near daily) with 58% drinking less since legalization. But 32% of occasional cannabis users (7 to 8 times a month) and 26% of infrequent marijuana users (2 to 3 times a month) report drinking less as well.”

DataTrek also pointed to some other statistics from the Quinn Thomas survey

Consumer Behavior

Comparing cannabis use before and after legalization:
Regular consumers who consume daily: Pre-legalization (48%), Post-Legalization (74%)

Occasional consumers who consume a few times a month: Pre-legalization (11%), Post-legalization (27%)

In what situations do you typically use cannabis?
On weekdays, during the work week: Yes, often (29%), Yes, occasionally (34%), No (37%)

On weekends and holidays: Yes, often (39%), Yes, occasionally (46%), No (16%)

By yourself: Yes, often (39%), Yes, occasionally (35%), No (27%)

So, what does Rabe come away with?

First, she said recreational marijuana legalization has led to greater demand across the board, from regular users to even infrequent users.

“If you’re invested in public marijuana companies, or want to do so, this is clearly a positive for the industry’s growth rates. That said, one blind spot in the report was its lack of mentioning the black market. We keep emphasizing that the legal cannabis industry’s total addressable market hinges on appropriate regulations and reasonable tax rates. Marijuana taxes in California and Washington, for example, are too high and support illegal sales. Since the black market has existed for decades, it’s already entrenched and efficient across the US. Regular users, in particular, likely already have “a guy” and won’t want to incur high tax fees even if they can buy it from legal dispensaries.”

Secondly, the more cannabis people consume, the less they drink.

“We also continue to note this important substitution effect because it has a meaningful impact on public liquor companies. Many have already been vocal about this risk. Liquor and beer sales are slowing or declining and further marijuana legalization across the US will likely accelerate these trends. That’s why liquor companies, such as Constellation Brands and Molson Coors, have either taken a stake in a Canadian marijuana company or have partnered with one to make non-alcoholic, THC-infused drinks.”

She added that if one is invested in the liquor industry, it’s important to understand that large public companies in that space haven’t just taken notice, but are already taking action to diversify their product offerings or business models. Those who don’t will likely lag behind.

And lastly, the report noted that their focus groups associated alcohol with “going out” and marijuana with “staying home”. Rabe said this is likely because consuming marijuana in most public places remains and is illegal.

“We think this will change as laws loosen, the cannabis stigma fades, and more legalization rolls out across the US,” she said. “The industry has already started developing an entire new distribution channel similar to bars and lounges. Consumers can go to marijuana cafes in Washington, for example. It’s still early days, but marijuana is creating a platform where eventually consumers don’t have to go to a bar for liquor, but can go to a cannabis club, marijuana bar, or of course just consume the drug at home.”

To see the entire Survey report from Quinn Thomas/DHM, please click here: https://www.quinnthomas.com/wp-content/uploads/2019/03/cannabis_next_door_report_march2019.pdf

We're Enhancing Your Experience with Smart Technology

We've updated our Terms & Conditions and Privacy Policy to introduce AI tools that will personalize your content, improve our market analysis, and deliver more relevant insights.These changes take effect on Aug 25, 2025.
Your data remains protected—we're simply using smart technology to serve you better. [Review Full Terms] |[Review Privacy Policy] By continuing to use our services after Aug 25, 2025, you agree to these updates.

Close the CTA