Liquidnet has launched a buy-side workflow to access bilateral liquidity from market makers in Europe, with XTX Markets named publicly as one of four electronic liquidity providers (ELPs) participating. Liquidnet stresses that these new channels will sit outside their multilateral trading facility (MTF) and will not touch the firm’s protected block-crossing network pool.
The agency broker said the initiative consolidates access to market-maker streams via its front-end application and liquidity-seeking algos, offering mid-price and touch executions with configurable, anonymous interaction and monitoring of fill rates and information leakage. According to Liquidnet’s recent ‘Liquidity Landscape’ report, bilateral activity now represents “close to 50%” of European equity volumes, a figure Global Trading believes is exaggerated by the lack of clear post trading reporting and flagging in Europe.
Gareth Exton, head of execution and quantitative services, EMEA, told Global Trading: “[The workflows] will not directly interact with liquidity resting in the Liquidnet pool. Members will choose to explicitly interact with this liquidity via separate workflows, away from the block crossing functionality.”
In the US, ATS-hosted ‘private rooms’, have attracted allegations that market makers were being admitted without participants’ knowledge and counterparties were not being disclosed; providers such as OneChronos and buyside traders have refuted the claims. For its part, Liquidnet says its bilateral channel will launch anonymised and remain segregated from its block pool.
Exton added: “By integrating bilateral liquidity into both our front-end application and liquidity-seeking algo suite, we’re giving our members the tools to access meaningful liquidity with confidence and control whilst helping the market-making community to extend their reach and better control their risk.”
The stream will sit outside the blocking network and trades are meant to happen at the SI limiting concerns about leaked trading axes of large natural flows from institutions.
At launch, only XTX is named publicly as a market maker on this stream; three additional market makers are also involved, but their names remain undisclosed. Liquidnet said that it is in active discussions with all other major liquidity providers.
The first phase of the service will cover equities, with ETFs seen as a potential next step.
The US Securities and Exchange Commission has greenlighted IEX’s plan to launch “IEX Options”.
The market which features a 350-microsecond symmetric access delay and an optional Options Risk Parameter (ORP) that can cancel or reprice market-maker quotes deemed stale when the underlying stock moves to ward off picking by latency arbitrager.
The SEC said: “After careful review, the Commission finds that the Exchange’s proposal, as modified by Amendment No. 3, is consistent with the requirements of the Act and the rules and regulations thereunder applicable to a national securities exchange”
The decision follows a heated process. Citadel Securities, as well as other large market makers and exchanges argued the delay/ORP would enable quote “fading” and harm investors and urged the SEC not to approve. IEX, smaller market makers, and academics said it would curb latency arbitrage and improve displayed liquidity. Support also came from trading firms such as Virtu, which called the design “well-intentioned” and potentially beneficial for retail execution.
Daniel Schalepfer had summarised the view of many mid tier liquidity providers saying: “Citadel’s intensely orchestrated campaign against IEX’s option market proposal has nothing to do with supposed concerns about fading liquidity or inaccessible quotes, or the welfare of retail investors”.
Brad Katsuyama, founder and CEO of IEX Group said to Global Trading: “We appreciate the SEC’s review and approval of the IEX Options proposal and thank the broad range of industry participants who went on the record in support of our options filing. IEX remains dedicated to innovating for performance and superior execution quality and looks forward to taking the next steps towards launching our options exchange.”
A Citadel Securities spokesperson responded to the news saying: “IEX’s quote-canceling scheme undermines the integrity of our markets, stealing money from millions of investors while IEX and a handful of market makers benefit at their expense.”
In our first Global Trading pre-trade and post-trade buyside survey, respondents from firms with trillions of dollars in combined AUM share their views on workflows, KPIs, vendors and the pain points they want to see resolved.
In a world with myriad, unpredictable liquidity sources, buyside equity trading is increasingly complex business. Deciding when and how to trade involves portfolio managers, who own most but not all of the P&L, and whose time is limited. Automation is essential, but waterfall-type workflows are needed to decide when and where to do it. And informing this decision requires a firehose of data.
And then, supposing that one does manage to trade, how do you evaluate the result post-trade? You don’t have to be a quant to know that trading has a market impact, but how should one measure it and disaggregate the effect of security and index characteristics, venue choice, and execution method or timing? Is it possible to integrate post-trade metrics into pre-trade decisions?
The time-honoured approach to both problems is to use a vendor, for the pre-trade analytics or transaction cost analysis (TCA) post-trade. Rather than simply ask traders for their opinion of such vendors, the buyside firms that spoke to Global Trading suggested a more detailed approach. And that led to our survey, where traders from some of the world’s biggest asset managers and pension funds provide insight into these kinds of questions.
Pre-trade
We start with the challenge of automation and complex execution. In terms of pre-trade metrics for this crucial task, 59% of buyside traders use vendor tools, and a significant 29% use tools provided by their brokers. One respondent expanded on this further: “We ask brokers to run pre-trade estimates for various flow scenarios”, as they put it. A smaller proportion – just 14% – responded that they use “In-house excel based tools linked to Bloomberg/Reuters”.
Armed with one of these three types of analytic tools, what kinds of key performance indicators (KPIs) do buyside firms use to adjust their execution and trading workflow? “Previous execution performance” accounted for almost half of responses here. However, a significant minority of 19% adopted a more dynamic approach, using broker indications of interest (IOI) or liquidity opportunities to make adjustments. Another 13% used brokers in competition, while the remaining 19% preferred a mixture of these three KPIs, which they supplement with volume data and portfolio manager discussions. As one trader told Global Trading, their KPIs have to be ‘smart’.
Having passed through the pre-trade metrics and workflow adjustments, traders then arrive at their execution/order management system (E/OMS), a key vendor product. We asked buyside respondents if they felt the need to supplement their E/OMS provider. A whopping 75% answered a clear ‘no’ to this question, while 14% of the remainder said they used pre-trade buckets, and 10% used third-party datasets. One respondent added a clarification: use third-party datasets for creating the trade, but E/OMS only for the trade itself.
Next, we asked respondents to name their favourite pre-trade analytics provider. Virtu came out ahead with 45% voting for the vendor, which is also a major E/OMS provider. Collectively, brokers were in second place at 27% of votes, and broker-owned analytics products that got mentioned by name included Nomura TradeSpex, Goldman Sachs Marquee, along with JP Morgan’s platform. After Virtu, Bloomberg was the favourite standalone vendor, with 9% of votes, while the same percentage of respondents told us that they used their own in-house analytics for pre-trade. BestX and big xyt trailed the pack with 5% of votes apiece.
Finally, we asked buyside respondents to comment anonymously on the most important ‘pain points’ in pre-trade that they wanted to see resolved. “More transparency on all available liquidity” was a widespread complaint, with several respondents highlighting the invisibility of OTC liquidity, amid calls for the long-overdue EU and UK consolidated tape. Trading baskets was another area where the buyside wants more vendor support, with requests for pre-trade analysis of multi-day baskets, along with cross-index futures trades and ETFs, and a plea for “strategy recommendations”.
The discrepancy between pre-trade and post-trade analytics bothered several buyside firms that wanted to leverage their existing TCA systems. One respondent highlighted pre-trade estimates “not matching” post-trade estimates, “making it difficult to justify actions”, while another that used multiple third-party analytics providers complained about the “significant” variance in estimates which “reduces confidence”.
Post-trade
Here, the first question asked buyside trading desks what their biggest constraint was. The responses were fairly evenly balanced, with 41% of respondents answering ‘liquidity’, and 34% telling us that portfolio manager requirements were most important. Surprisingly, ‘cost’ was a fairly distant third at 25%.
One explanation might come from the next question, where we asked buyside respondents whether trading was a profit centre at their firm. Just over half (52%) of traders answered with an outright ‘no’ – in other words, for these traders, portfolio managers owned all the P&L. We also allowed partial answers to this question, with 15% stating that block trades were a profit centre, and 11% included cash as an alpha generator. Just 7% of respondents were completely responsible for trading alpha.
Whoever owns it, trading alpha does need to be evaluated, and the following post-trade question zeroed in on how respondents evaluated it. Three quarters of respondents told us that their TCA provider calculated alpha for them, with 16% using ‘custom data analysis’ and just a handful using proprietary methodology.
That leads naturally to the following question for the buyside – who is your favourite provider of post-trade analytics (which can be treated as synonymous with TCA)? This time, Virtu’s dominance was more pronounced than the pre-trade vote, with 68% of respondents choosing this provider. BestX was in second place at 12% and ISS LiquidMetrix in third place at 8%. Distant runners up included Bloomberg, big xyt and BMLL.
Lastly, we asked respondents to describe their post-trade ‘pain points’. Several pinned their hopes on the regulator-driven EU and UK consolidated tape for TCA purposes, while another complained about ‘regulatory overreach’ in this space. Mindful of this wider discussion, other respondents fretted about vested interests, with one plea that “FIX tags consistency should be driven by clients and TCA providers”, and a complaint about the role of HFT firms, which resulted in an “ELP tax from short-term behaviours”, according to one buyside trader.
A sizeable contingent of traders just wanted a better service from their TCA vendors, making specific requests: “% flow concentrations at set pricing times”, “Ease of flagging/excluding outliers where appropriate”, “More dynamic and cleaner venue analysis” and “Easier tagging of contingent trades”, were some of the responses received.
Or perhaps vendors should simply update their technology. “Would love to see AI integration from TCA providers in order to enhance the analysis”, was the comment of one buyside firm.
The SEC is holding a trade-through roundtable looking to repeal or amend Rule 611, also known as the Order Protection Rule (OPR), which the SEC’s new Chair Atkins as long been against. Global Trading got hold of comments from the FIA Principal Traders Group (PTG), which represents the biggest American market makers, supporting a repeal of the rule.
Stakeholders have had their say: McKay Brothers argues calibration, and market veterans are split over whether Rule 611 still serves investors or now stands in the way of innovation and more efficient markets.
“A long time ago, in a galaxy not far away, the NYSE Empire was the dominant stock exchange in the universe,” is how Georgetown professor James J. Angel opens his submission for the SEC’s trade-through roundtable. It sets the tone: technology and competition, not regulation, dismantled the old network advantage.
FIA Principal Traders Group (FIA PTG) will publicly support repealing Regulation NMS Rule 611 – the trade-through prohibition, in forthcoming comments. The group, which represents the biggest market makers from Citadel Securities to Jane Street, Hudson River Trading, IMC and Wolverine, makes the case that the rule has outlived its purpose, inflated costs, and distorted incentives around quoting, fees, and venue proliferation. It also advocates for amendments to how securities information processor (SIP) revenues are shared, in order for exchange competition to focus on execution quality rather than regulatory protection.
Georgetown University’s Angel believes the OPR is redundant with brokers’ best-execution duty, and states that most developed markets function without it, while retail execution would be unaffected as it is already internalised in most cases. He thinks policy should move beyond the national best bid offer (NBBO) and look to consider the depth of the consolidated order book using an indicative best bid offer (IBBO) and an effective best bid offer (EBBO) to reflect available liquidity.
SEC staff data presented as documentation to the roundtable adds momentum to reformers’ case. Measured trade-throughs are already minimal, suggesting a blanket, venue-agnostic prohibition may no longer be necessary.
Market-infrastructure firm McKay Brothers/Quincy Data wants to keep OPR, but to have this feature be earned by exchanges rather than due to them. They also say the feature should only be available to immediately accessible quotes to the detriment of exchanges / venues offering speed bumps. They also suggest requiring exchanges to have a small but sustained market-share threshold (proposed at 2.5%). Finally, they propose changing SIP revenues allocation toward executions to reward displayed liquidity that actually trades and put a stop to exchange proliferation. Looking to the future of latency arbitrages, they propose an Observer BBO to account for geographical latency.
Cboe backs a “do no harm” approach that preserves a reliable NBBO and curbs venue proliferation by conditioning protected status and quote credits for new exchanges on demonstrated demand through market shares, but stress that options market dynamics differ from equities and should not be subject to the same changes.
Opponents of the rollback argue Rule 611 still disciplines routing and protects investors. Market structure advocate R.T. Leuchtkafer, anonymous but ever present in SEC comments, cautions that weakening Rule 611 would privilege speed advantages and erode competition, pointing to benefits he says have saved investors money over time.
Anwiti Bahuguna, global co-chief investment officer, Northern Trust Asset Management
Anwiti Bahuguna has been promoted to global co-chief investment officer at Northern Trust Asset Management.
As of June 30, NTAM held US$1.3 trillion in assets under management.
Based in Chicago, Bahuguna will share the role with Christian Roth. She both replaces and reports to Michael Hunstad, who was recently named NTAM president after the departure of Daniel Gamba.
With close to 30 years of industry experience, Bahuguna has been deputy chief investment officer at NTAM since 2023. Prior to this, she was a senior portfolio manager and head of multi-asset strategy at Colombia Threadneedle Investments for over 17 years.
Bahuguna began her career at FleetBoston Financial as a senior research analyst, later moving to Bank of America as an asset allocation product analyst.
Neel Laungani, APAC head of financial sponsors, Barclays
Barclays has named Neel Laungani as APAC head of financial sponsors.
In the Hong Kong-based role, Laungani is responsible for financial sponsor transactions origination and execution in the region.
He reports locally to APAC head of investment banking Avinash Thakur, who joined the firm earlier this year, and Christian Oberle, global head of financial sponsors.
Part of the investment banking business, Barclays’ financial sponsors division works with private equity firms and investment funds. Earlier this year, Jason Short was appointed a managing director within the group, while Isobel van Daesdonk and Scott Willard were named managing directors in the Americas.
Barclays reported £1.2 billion in investment banking revenues for H1 2025, up 1% year-on-year.
Thakur commented, “As a top five global financial sponsors franchise, we have the global reach and sector depth across the world’s largest financial centres, which is a key differentiator to our clients. Neel will be instrumental in growing our advisory and ECM activities with sponsor clients – one of our key priorities.”
Laungani has more than three decades of industry experience, and joins Barclays after almost three years at Credit Suisse as APAC head of financial sponsors and vice chairman of APAC technology, media and telecom (TMT) investment banking. Prior to this, he was head of APAC TMT at Deutsche Bank.
He has also held senior roles at Standard Chartered Bank and Lehman Brothers.
A three-way contest for flexible equity derivatives volume is shaping up between Eurex, Cboe and the giant OTC derivatives market.
Cboe Europe Derivatives (CEDX) said it plans to launch FLEX options in Europe, extending a US product it pioneered in 1993 to let traders negotiate key contract terms, like in bilateral OTC trades —strike, expiry, exercise style and settlement— within the safety of an exchange rulebook and central clearing.
The move directly challenges Eurex’s long-running “flexible contract” facility.
A spokesperson for Eurex told Global Trading: “We are in ongoing conversations with various market participants on our flexible derivatives offering and are exploring options to further enhance it.”
Cboe announced the plan at its risk management conference in Munich. The go-live is targeted for Q1 2026. At launch, CEDX expects to list FLEX on a select set of Cboe equity indices, single stocks, and ETFs, and expand coverage through 2026. All trades will clear at Cboe Clear Europe, its pan-European central counterparty (CCP).
Iouri Saroukhanov, head of European derivatives at Cboe Europe said: “We’re excited to bring Cboe FLEX options to the European market, reflecting our continued commitment to innovation and building a bigger, more efficient and transparent listed derivatives ecosystem across the region.”
FLEX options are designed to give traders OTC-like customisation with some of the exchange transparency and CCP netting, a mix, that Cboe and Eurex say, lowers counterparty, operational and capital costs versus bilateral deals, especially as defined-outcome products and bespoke overlays gain traction among asset managers.
The launch puts Cboe in more direct competition with Frankfurt-based rival Eurex, which has offered flexible contracts since 2005 via its T7 entry service (TES)/off-book workflow. With Eurex flexible contracts, traders can define exercise price, expiry, style, and settlement, and similarly to OTC trades, flexible contracts trades are not disclosed intraday.
As of 15 September, 7.87 million flexible contracts were traded at Eurex year-to-date, versus 213 million total equity option contracts. If the 3% flexible contract share of option volume were extended to open interest, that would imply about US$11.8 billion in flexible-contract OI. Flexible option like OTC are often intended to be held rather than traded, making the actual OI likely to be of this figure. That compares with US$50 billion of OTC European equity-options gross market value (similar to Open Interest value) at the end of 2024 according to the BIS. For US equity OTC options, the BIS figure was US$279 billion GMV. Cboe did not comment on the value of its own FLEX open interest but said its volume have grown from two million contracts traded in 2019 to 35 million so far in 2025.
OTC derivative gross market value is reported by dealers to the BIS at replacement cost which makes a like-for-like comparison with listed derivatives difficult.
A Eurex spokesperson told Global trading: “Eurex sees increased volumes in Flex options, especially in the single equity space, where we are already above last year’s volume. It’s likely that this trend will continue.”
Michael Richter, global head of product for trading analytics at S&P Global Market Intelligence.
S&P Global is shuttering its transaction cost analysis (TCA) operations, according to sources familiar with the matter.
Michael Richter, EMEA executive director of TCA at the firm, could not be contacted for comment.
S&P’s TCA services cover equities, FX, fixed income, credit default swaps, loans and money market instruments. It has been operational since 2011.
The service sits within the firm’s Market Intelligence business, which produces the largest portion of its revenues. In Q2 2025, S&P Global reported US$1.2 billion in Market Intelligence revenues – up 5% year-on-year.
An S&P Global Market Intelligence spokesperson told Global Trading, “S&P Global Market Intelligence continually evaluates its product portfolio to meet the evolving needs of our clients. While we won’t comment on specific decisions, we are committed to keeping our clients informed of any updates.”
JP Morgan is losing traction in EMEA, Dealogic data suggests. Preliminary rankings show that the bank has fallen from first to fourth in equity capital market (ECM) revenues year-to-date, with an 8.7% share and US$133 million, and from first to fifth in volumes as a bookrunner, with a 7.4% share and US$8.4 billion.
The bank lost its executive director of global equities to Citi in May.
Citi saw the greatest improvement of the cohort, up from sixth to third with US$136 million and an 8.9% share. DNB Carnegie made it onto the table from 12th to tenth, with a 2.4% share and US$37 million in revenues.
Citi’s performance compared to JP Morgan’s may be the result of its poaching key bankers from competitors.
Goldman Sachs (US$154 million, 10.1% share) and Morgan Stanley (USUS$137 million, 9% share) both rose a place to take first and second in revenues for the region.
By volume, the two leaders were followed by BofA Securities and BNP Paribas. Barclays fell from third to eighth place, with US$3.8 billion and a 3.3% share.
Globally, investment banking league tables have remained broadly unchanged year-on-year (YoY).
Aside from a negligible increase in Jefferies’ revenues pushing it above Wells Fargo (with both banks retaining a 2.8% share), rankings by revenue were stable. JP Morgan retained its top spot with an 8.7% share and US$5.9 billion, trailed by Goldman Sachs with a 7.8% share and US$5.3 billion and BofA Securities, with a 6.2% share and US$4.2 billion in revenues.
In equity capital markets revenues, while the top of the table looks familiar – JP Morgan ahead with a 10.8% share and US$1 billion in revenues, Morgan Stanley overtaking Goldman Sachs with a 9.1% share and US$907 million – two banks have broken into the top ten. UBS climbed from 11th to 10th with a 2.3% share and US$227 million, while Cantor Fitzgerald & Co rose from 13th to ninth place, taking a 2.4% share with US$237 million.
The bank saw a significant improvement in its US ECM ranking by revenue, up from 11th to seventh place. Revenues were a reported US$174 million, representing a 3.7% share.
Global ECM volume rankings YTD by bookrunner have seen JP Morgan and Goldman Sachs swap places, taking first and third respectively. The former holds a 10.4% share with US$55.5 billion in volumes, and the latter 8.9% and US$47 billion. Morgan Stanley remains between the two, with a 9.5% share and US$50.7 billion in volumes.
At the other end of the scale, TD Securities jumped nine places to 10th, its 2% market share representing US$10.7 billion in volumes. In the US, it rose from 11th to fifth place. The bank named Bryan Wrapp managing director of investment banking in April.
Morgan Stanley and JP Morgan remained at the top of the pile for ECM revenues in APAC (ex-Japan), with US$207 million and US$159 million respectively, representing 9.1% and 7% of the market. UBS rose from ninth to third with a 5.2% share and US$118 million.
China-based Guotai Haitong Securities was down from third to fifth.
By volume, Citi fell from first to fifth with US$7.8 billion (4.5% share), replaced by Morgan Stanley, up one place with a 10.3% share and US$18 billion.
HSBC saw significant growth, up 18th to eighth, while Huatai Securities Co rose from 16th to ninth and Guotai Haitong Securities was up from 12th to tenth.
Increased uncertainty across global financial markets has tested the capacity of financial institutions to optimise their use of capital. The growing risk also creates a need for larger capital buffers, potentially paralysing capital that could be used to support revenue generation.
At the same time, over the longer-term, regulatory and cost pressures are accumulating which ties up resources, and in turn, limits business growth. Not only does this created a combined pressure on firms but also reduces the internal liquidity of their capital.
In this environment, more effective capital management becomes a competitive advantage for broker-dealers. The capacity to reduce costs in post-trade could be the gamechanger for companies to navigate the current market complexity. At a roundtable recently held by Markets Media and BNP Paribas’ Securities Services business, colleagues from a range of market operators, broker dealers and market participants discussed how they are being affected by market volatility, its effect on capital management, and their models for working around these constraints.
Market perspectives from NZX and HKEX
GT Roundtable
The discussion opened with representatives from New Zealand Exchange (NZX) and Hong Kong Exchanges & Clearing (HKEX) groups outlining their respective markets and the pressures their members were facing. Larger global brokers in these markets are often well-capitalised based upon their multi-jurisdictional capital rules. However, there are also plenty of local and regional members whose capital requirements are lighter and potentially face a more challenging capital environment if risks increase. As a consequence, these firms appreciate their partners in market infrastructure who can better support them through efficient capital management, notably through post-trade services.
Capital and risk controls in trading and clearing
In both market-maker and clearing businesses, it was noted that firms were increasingly consolidating as a result of commercial pressures and heightened sensitivity to use of capital.
Sell-side firms reported that cost has been a major concern across the board, and analysis within operations teams has led to a revision of the type and number of systems that were being used, as well as capital arrangements.
The role of post-trade costs in strategic decision-making
Kathy Ong, director of product management Asia Pacific, Securities Services at BNP Paribas.
Kathy Ong, director of product management Asia Pacific, Securities Services at BNP Paribas, said, “If you look at different types of costs, firms historically focussed on trading cost. But when you build in post-trade costs such as clearing, market fees, and regulatory capital (which is significant in Hong Kong), net costs per trade will rise dramatically.”. Companies are taking more notice of those when assessing strategy and feasibility. In Hong Kong SAR, we have the added challenge of T+0 in Stock Connect. When you map out regulatory and operational risks on smaller scale operations, how do they grow their margins? Unless they can achieve a particular size, it becomes a challenge.”
The asset class in question carries specific risks. It was noted that fixed income markets, being over-the-counter (OTC) face greater risks. Failed trades are more common in the fixed income space, with some clients being very sensitive to this, such as foreign clients or central banks.
“They don’t want their trades to fail, but if they are buying and an intermediary is selling to them, while buying from another counterparty simultaneously, and that counterparty doesn’t deliver, how can the intermediary deliver it to the other?” one attendee said. “Exchange fails are less common as trading is centrally managed.”
Regional trading holidays pose another issue for gaps appearing between trading and post-trade activity, creating challenges where investors would trade instruments in another market, but regional trading holidays force intermediaries to process extended period from trade to settlement, which have accounting implications, and the risk of extending credit for an elongated period of time to a client.
“They may not necessarily like that either, so there’s an internal review process around that and cost is very important because for that extended period, you may have to do a repo to fund the inventory, because the other side of the trade may have a normal settlement period. There are implications.”
If the intermediary did not anticipate this when initiating the trade, the question arises as to how they build this cost/risk dynamic back into the trade. Consequently, there is a convergence of awareness of front, middle and back office mindfulness to incorporate these costs as part of the trading world.
Overlap with operational resiliency and mitigating volatility
For the major banks in attendance, managing growth locally and internationally was a key consideration for C-suite decision makers. That made awareness of operational constraints a priority, due to the impact under both calm and testing market conditions.
One firm also noted that when scaling up, its reliance on manual processing was a massive barrier to rapid growth. For example, the recent volatile market conditions have created operational pressure and capital constraints for the firm.
In addition to OTC markets, equity markets are also seeing increased automation following their electronification. This boost to automated e-trading has resulted in very low margin and high-volume business units that must operate with maximum efficiency, focusing on streamlining operations and reducing costs.
While regulation creates the framework for capital rules, some participants suggested that the current framework created challenges for market participants, as well as potentially increasing systemic stability.
“The Global Financial Crisis really drove two big market initiatives from a regulatory standpoint” noted one participant. “Firstly, capital and operational risk or counterparty credit risk measures were applied. Then bankruptcy procedures were set up. While the former evolved through mutually recognised global regulators, the latter regimes did not. From Hong Kong we see a lot of market participants trying to deal with that asymmetric model. Defaulting on one central counterparty (CCP) has an established procedure, but then how do you deal with the liquidation of those, and porting? In addition to that, how do they deal with different bankruptcy procedures in different jurisdictions?”
This is also a challenge in European and US markets. However, this issue is in a much greater magnitude in Asia due to jurisdictional fragmentation.
“Trading and clearing can go global, but settlement is a whole different conversation, and there’s a lot of repeated exercise in terms of processes and operation,” said another participant. “Capital has to be double-funded in many cases. So, this raises capital cost.”
Consolidation is taking place in the clearing space as there are fewer firms who are capable of clearing trades and standing behind a guarantee from an intermediary perspective.
“We do have to take into consideration what that means if a default situation happens in another jurisdiction as it relates to the Hong Kong entities,” noted one attendee. “Regulation in Asia is becoming a lot more conservative. Regulators are taking a more rigorous approach, including anti-money laundering and sanction practices. These add costs and this is aggregating in the region.”
Supporting the sell side
HKEX has seen 800 cash market members ten years ago reduce to just above 600 today, while its derivatives business has fallen from nearly 200 clearing members to 153.
Tae Yoo, managing director of global client development, HKEX
“Hong Kong’s cash market ADT exceeded HK$240bn (US$31bn) in the first half of the year, up over 118% year-on-year, and investor interest is still growing,” said Tae Yoo, managing director of global client development for HKEX. “However, the market needs to deal with the risks associated with a more concentrated broker community operating in different jurisdictions in Asia that also have different risk profiles, bankruptcy procedures and counterparty clearing risk management procedures. That’s why we are seeing brokers trying to enhance their settlement and post-trade operation to manage these risks.”
For a smaller market like New Zealand, it is crucial to right size the size and scale of its market, while not overlaying excessive additional regulatory and cost given its size.
Brandon Tai, head of secondary markets development, NZX
“We must make it easy to trade and clear, we can’t have barriers to access,” says NZX’s head of secondary markets development, Brandon Tai. “Then looking at post trade in New Zealand, the market has two CSDs which creates operational inefficiencies, but there was no discussion at an industry level at the time about that development.
“Now, 15 years later, we’re operating in an environment where on-market execution trading is happening through the exchange and the CCP, with institutional flow also going across the other CSD,” he continued. “BNP Paribas’ Securities Services business is bridging the gap, though membership of both CSDs but we think there needs to be a conversation because all of those transactions just layer on cost inefficiencies. We are agnostic as to what change looks like.”
Some larger brokers have been able to build platforms themselves to tackle risk management and efficient capital optimisation internally, which has supported their business in periods of raised volatility. However, brokers who have not invested in this way can find these periods more difficult.
Partnering for success
“In terms of capital efficiency, I would say our business is very efficient in running our balance sheet in a very inefficient manner,” said one participant. “We obviously want to be efficient and squeeze the most out of it. In times of volatility that becomes hard because the way that we do it is still very manual. Our team’s challenge is trying to make that process more efficient. You’ve got so many systems and processes and people that you need to get involved when you’re trying to be capital efficient, so that’s our biggest challenge.”
Another noted that from a volume perspective, volatility was great, but it creates its own challenges operationally.
“Specifically, to do with capital, we’ve been engaged in coming up with ways of how we can reduce costs,” said another participant. “Looking at our target operating model and then removing some of those cost pressures related to the services that we avail externally, BNP Paribas’ Securities Services business has been helping us with one of those big projects. We are looking at the target operating model and seeing what we can move to a bigger balance sheet within the wider group, so that we reduce some of those regulatory capital impact we have here.”
Third-party clearing was cited as a clear winner for better efficiency, for all of the dealers in discussion.
A major broker dealer observed, “The easiest way to be more capital efficient, and at least the reduce the capital once, is to utilise a bank entity to become a clearer. That’s where the Securities Services at BNP Paribas service came into play and not just in Hong Kong, that can be applied to any markets. TPC is quite an easy choice for me.”


 We start with the challenge of automation and complex execution. In terms of pre-trade metrics for this crucial task, 59% of buyside traders use vendor tools, and a significant 29% use tools provided by their brokers. One respondent expanded on this further: “We ask brokers to run pre-trade estimates for various flow scenarios”, as they put it. A smaller proportion – just 14% – responded that they use “In-house excel based tools linked to Bloomberg/Reuters”.
 Armed with one of these three types of analytic tools, what kinds of key performance indicators (KPIs) do buyside firms use to adjust their execution and trading workflow? “Previous execution performance” accounted for almost half of responses here. However, a significant minority of 19% adopted a more dynamic approach, using broker indications of interest (IOI) or liquidity opportunities to make adjustments. Another 13% used brokers in competition, while the remaining 19% preferred a mixture of these three KPIs, which they supplement with volume data and portfolio manager discussions. As one trader told Global Trading, their KPIs have to be ‘smart’.
 Having passed through the pre-trade metrics and workflow adjustments, traders then arrive at their execution/order management system (E/OMS), a key vendor product. We asked buyside respondents if they felt the need to supplement their E/OMS provider. A whopping 75% answered a clear ‘no’ to this question, while 14% of the remainder said they used pre-trade buckets, and 10% used third-party datasets. One respondent added a clarification: use third-party datasets for creating the trade, but E/OMS only for the trade itself.
 Next, we asked respondents to name their favourite pre-trade analytics provider. Virtu came out ahead with 45% voting for the vendor, which is also a major E/OMS provider. Collectively, brokers were in second place at 27% of votes, and broker-owned analytics products that got mentioned by name included Nomura TradeSpex, Goldman Sachs Marquee, along with JP Morgan’s platform. After Virtu, Bloomberg was the favourite standalone vendor, with 9% of votes, while the same percentage of respondents told us that they used their own in-house analytics for pre-trade. BestX and big xyt trailed the pack with 5% of votes apiece.
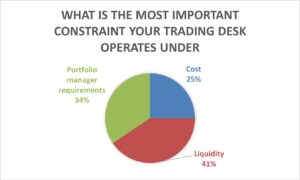 Here, the first question asked buyside trading desks what their biggest constraint was. The responses were fairly evenly balanced, with 41% of respondents answering ‘liquidity’, and 34% telling us that portfolio manager requirements were most important. Surprisingly, ‘cost’ was a fairly distant third at 25%.
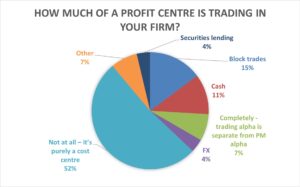 One explanation might come from the next question, where we asked buyside respondents whether trading was a profit centre at their firm. Just over half (52%) of traders answered with an outright ‘no’ – in other words, for these traders, portfolio managers owned all the P&L. We also allowed partial answers to this question, with 15% stating that block trades were a profit centre, and 11% included cash as an alpha generator. Just 7% of respondents were completely responsible for trading alpha.
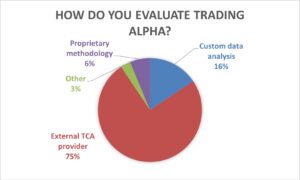 Whoever owns it, trading alpha does need to be evaluated, and the following post-trade question zeroed in on how respondents evaluated it. Three quarters of respondents told us that their TCA provider calculated alpha for them, with 16% using ‘custom data analysis’ and just a handful using proprietary methodology.
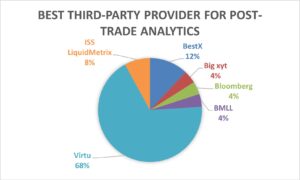 That leads naturally to the following question for the buyside – who is your favourite provider of post-trade analytics (which can be treated as synonymous with TCA)? This time, Virtu’s dominance was more pronounced than the pre-trade vote, with 68% of respondents choosing this provider. BestX was in second place at 12% and ISS LiquidMetrix in third place at 8%. Distant runners up included Bloomberg, big xyt and BMLL.
")