Brown has more than 20 years of experience, most recently serving as head of emerging cash equities execution at Citi. Prior to this, he was head of emerging equities trading at Morgan Stanley.
Throughout his career, Brown has been an equities trader at Morgan Stanley’s South African company (co-owned with Rand Merchant Bank), Bank of America and Credit Suisse, where he focused on emerging markets.
James Bastick has also joined Panmure Liberum as a director and equity trader. He is based in London.
Bastick has almost a decade of industry experience and joins the firm from Singer Capital Markets, where he has been a UK equities market maker since the start of the year. Prior to this, he was a UK equities dealer at Winterflood Securities.
With more than 20 years of experience Foley joins KCx from alternative trading system Provable Markets, where he has been managing director of sales since 2022. Prior to this, he was head of sales and an electronic sales trader at Proof Trading and part of the business development team at IEX.
More than a decade of his career was spent at Liquidnet, where he held roles including Japan country manager, head of US equity desktop trading, and global sales manager.
Clients purchased US$4.3 billion in single stock US equities at Bank of America last week, the firm said, marking a two-year record.
The week also represented the group’s tenth largest inflows since 2008, BofA reported
The majority of this activity went into large caps, BofA said, particularly looking at tech stocks (US$3.14 billion in inflows). This was led by institutional clients, who were buying for the second week in a row and reached the highest levels of net buy since September 2024.
Institutional investors had been sellers since May.
Financials (US$883 million), discretionary (US$590 million) and staples (US$443 million) were also popular categories, with stocks bought in seven of the 11 categories tracked by the bank. Industrials (-US$809 million), healthcare (-US$345 million), communication services (-US$140 million) and real estate (-US$30 million) saw the largest outflows over the week.
Alongside institutional investors, retail, corporate and hedge fund clients were also all buyers for a second week running. Private clients have been the most consistent buyers recently, the bank noted, buying for 33 of the last 35 weeks and on a six-week inflows streak.
Although single tech stocks were riding high, passive investment in the sector is waning – with tech exchange-traded funds (ETFs) reporting the largest outflows last week. Consumer staples led the race, and also hold the largest four-week average for inflows.
Blair has more than 25 years of industry experience and joins the firm from boutique investment banking firm Liquid Venture Partners, where he has been director of equity capital markets for over a decade.
Earlier in his career, Blair was senior vice president of sales trading at Penserra Securities and an equity and sales trader at ThinkEquity.
A third of US buy-side equity traders are using broker-provided analyses for transaction cost analysis (TCA), according to a Coalition Greenwich report – up from 20% in April 2024.
These analyses tend to be in the form of one-off or scheduled reports.
The majority (88%) of traders are outsourcing their TCA to third-party vendors, the report found – up from 80% of survey participants in April 2024. This strategy captures data from across asset managers, which respondents said allowed for an unbiased view of trading performance. Convenience, alongside low infrastructure and personal investments, were also favoured benefits.
Report author Jesse Forster, market structure and technology advisor at Coalition Greenwich, notes that established firms are preferred over new players, as clients aim to minimise the risk of introducing new technology.
“Traders tend to stick with trusted vendors rather than exploring new options,” he adds.
Just 18% of those polled were using a proprietary TCA system and only 10% said they used a proprietary/vendor hybrid system. Those opting for an in-house approach tended to be larger asset managers requiring more tailored TCA strategies, Coalition Greenwich explained. These platforms can also be integrated into existing systems, with firms able to maintain control over their data and analytics.
The report finds that almost half of US buy-side equity traders believe that TCA data is an important or very important tool when evaluating brokers.
Just 5% of traders stated that they did not incorporate TCA data into their broker evaluations – although all desks polled confirmed that they had used TCA for equity trading at some point over the last year. Close to 80% had done so on a quarterly basis.
This marks an increase from Coalition Greenwich’s April 2024 report, which noted that under 90% were conducting TCA for equity trading.
Post-trade analysis – the original purpose of TCA – is its most important feature used in equity trading, according to 90% of respondents. A further 53% cited oversight and reporting, highlighting the industry’s growing focus on compliance and regulatory requirements, while 38% stated that pre-trade modelling is a priority.
Despite its popularity, Forster observes, “Some expressed skepticism about the usefulness of pre-trade models, viewing them as primarily a means of justifying trading decisions, particularly in cases of underperformance.”
Citi has appointed Jignesh Patel as APAC head of prime finance as it continues to build out its presence in the region.
The announcement follows comments from Japan, Asia North, Australia (JANA) head of markets Paul Smith earlier this year that the company planned to increase its prime business headcount in the region by 5-10%.
Citi performed well in Q2 2025, with the markets division reporting US$5.9 billion in revenues – including a record quarter for equities, with a reported US$1.6 billion in revenues. Within this, the company says, prime balances were up 27%.
Based in Hong Kong, Patel reports to APAC head of equity trading Robert Stewart and Sebastien Mailleux and Tim Tomalin-Reeves, global heads of prime services.
In the role, Patel is responsible for the overall growth of Citi’s prime finance service in the region. He also oversees prime product stock borrow and lending, synthetic prime brokerage, funding trading, and in-business risk.
Patel joins Citi from Millenium, where he was Asia treasurer overseeing portfolio financing, liquidity management, cash and collateral management and counterparty risk. The bulk of his career has been spent at Goldman Sachs, where he co-managed the Asia prime business. He was with the company for close to 30 years.
City Different Investments: Fed uncertainty, mixed data signals, and record muni supply.
As fiscal, monetary, and economic growth forces drive fixed income activity, Trader TV speaks to Sweta Singh at City Different Investments about how trading desks are navigating the current market uncertainty and mixed data signals. Singh discusses the Fed’s interest rate trajectory, tariffs data, and the record-high municipal bond issuance for June and July. Amid these conditions, she shares where she sees value in the US treasury curve and looks at tactical opportunities for traders to capitalize on this summer.
Payments for order flow are soaring, reaching about US$953million in the second quarter of 2025, and the spoils are concentrated among a handful of brokers and market‑makers. App-based brokers’ option orders are where the money is: in Q2 2025, market makers paid US$56 cents per option contract for Robinhood flow; significantly higher than the US$ 40 cents paid for Schwab’s, with Webull at US$38 cents, Fidelity US$35 cents, and Tastytrade US$41cents.
Data source: S3
In May alone, market makers paid retail brokers US$340 million, up about US$115.9 million or 51.6% from May 2024. Citadel Securities accounted for US$122.8 million, more than a third of the monthly total. Robinhood collected US$128.3 million in May, or US$49.2 million more than a year earlier. Although trading cooled in June, payments across the entire second quarter still reached US$953.5 million, up US$61.8 million (6.8 %) from the first quarter’s US$891.7 million and up more than 64 % year on year (YoY).
Across the spring quarter, executed volume, shares plus option contracts (accounted for in shares equivalent by multiplying contracts numbers by their quotity multiplier), jumped from 373.6 billion units in Q1 to 420.1 billion in Q2. With trading volume expanding faster than dollars spent for flows, the average equity payment for order flow (PFOF) fee fell from US$12.4 cents to US$11.5 cents per hundred shares, while the average options fee paid by market makers (excluding exchange-affiliated flows) rose from US$41.7 cents to US$44.2 cents per contracts.
Flow composition also shifted. Payments tied to market orders increased by US$18.7 million to US$208.5 million between Q1 and Q2. Marketable limit order rebates held steady at US$269.5 million, while non-marketable limits added US$20.8 million to reach US$333.2 million. “Other” orders, stops and conditional orders, generated US$142.3 million, up US$20 million.
Citadel Securities extended its dominance in payment for order flow volume, raising its quarterly spend from US$311.2 million in Q1 to US$340.6 million in Q2. IMC followed with US$195.8 million, up US$15.1 million. Susquehanna and Wolverine paid slightly less quarter on quarter at US$102.3 million and US$82.4 million respectively, while Jane Street displaced Virtu among the top five by paying US$76.1 million.
On the receiving side, Robinhood’s haul climbed to US$342.6million, still behind Schwab’s US$375.2 million. Options remained the engine of monetisation: market makers spent US$636.3 million on options flow in Q2, versus US$317.2 million on equities.
Drilling down by instrument type, Robinhood customers generated US$270.5 million in options PFOF but only US$72.0 million from equities, whereas Schwab’s mix was US$194.9 million in options and US$180.3 million in shares. Citadel spent US$232.6 million buying options flow in Q2 compared with US$108.0 million for equities. IMC and Wolverine remained pure‑options houses; Virtu and Hudson River Trading focused exclusively on equities; Jane Street paid US$61.3 million for stock flow and US$15.2 million for derivatives.
Pricing varies widely depending on market maker. In options, Citadel paid around US$60.0 cents per contract to Robinhood and US$41.2 cents to Schwab. IMC paid US$54.4 cents to Robinhood and US$43.4 cents to Schwab. Susquehanna paid US$60.5 cents to Robinhood and US$42.6 cents to Schwab, while Wolverine paid US$42.4 cents to Robinhood and uS$30.1 cents to Schwab. Morgan Stanley (acting as a market maker) paid US$62.4 cents per contract to Robinhood and executed no meaningful Schwab flow in Q2. Across all market makers, other app brokers’ options flows were priced in between: Webull averaged US$37.5 cents, Fidelity US$35.2 cents and Tastytrade US$40.8 cents per contract.
In equities, the gap was smaller but still visible. Citadel paid about US$14.29 cents per 100 shares to Robinhood versus US$9.51 cents to Schwab. Virtu paid US$14.32 cents to Robinhood and US$10.34 cents to Schwab. Susquehanna paid US$19.85 cents to Robinhood and US$9.45 cents to Schwab, while Jane Street paid US$9.45 cents to Robinhood and US$12.06 cents to Schwab.
Volumes traded by retailers corroborate the economics. Robinhood customers executed 56.3 billion shares and 483.21 million contracts in Q2, up from 37.9 billion shares and 479.2 million contracts in Q1. While the number of options traded is less than 1% of the shares traded (or 83% of the shares equivalent traded multiplying each contract by 100), they generated 80% of its PFOF. Schwab processed 170.3 billion shares and 488.0 million contracts in Q2, versus 148.2 billion shares and 478.6 million contracts in Q1. Options in shares equivalent traded represented 28% of the stocks it traded while accounting for just over half its PFOF.
A Schwab spokesperson said the firm’s routing decisions are driven by execution quality consideration rather than PFOF: “At Schwab, we put our clients’ interests first. Best execution for our clients always takes priority when determining where to route orders. Any eligible rebates from a particular market centre are not a consideration in order routing decisions.”
Robinhood did not respond to requests for comment.
Market makers’ activity is also as differentiated as ever, with Citadel Securities leading in both equities and options execution. They traded 99.2 billion shares and 502.4 million option contracts in Q2. IMC and Wolverine remained pure options players; they traded 431.9 million and 239.4 million contracts, respectively. Virtu and Hudson River Trading routed tens of billions of shares and negligible derivatives. Jane Street increased its share volume for the quarter to 52.8 billion and traded 39.0 million option contracts; Susquehanna sat in between, trading 26.6 billion shares and 164.4 million option contracts.
A branch of artificial intelligence first used to master Atari video games is not an obvious choice for applying AI to trading. But deep reinforcement learning excels at playing the stock market, according to a paper by Jedrzej Maskiewicza and Pawel Sakowski. The AI trader can choose trading strategies in response to market conditions, and is assigned a reward function that measures how well the strategies perform. A neural network learns to choose strategies that minimise the difference between predicted and actual rewards based on the current market state. When applied to daily trading on liquid equity and FX markets, this approach outperforms other machine learning-based approaches. (Link to paper: 2506.04658 )
Using AI doppelgangers to trade Chinese limit order books
High-frequency trading of Chinese stocks is challenging – the limit order book updates only every 3 seconds, and stock prices typically jump after the close. Jiahao Yang, Ran Fang, Ming Zhang and Jun Zhou tackle this challenge using long short-term memory (LTSM) networks – an AI technique developed before large language models – with a twist. They deploy a pair of ‘Siamese twin’ deep learning networks to the bid and ask side of the order book, encoding the LOB into a features vector that is used to predict the next state of the market. The approach outperforms other techniques, especially when the LOB is compressed using order-flow imbalance. (Link to paper: 2505.22678 )
Source: Jiahao Yang, Ran Fang, Ming Zhang and Jun Zhou.
Benchmarking Bloomberg’s TCA formula using agent-based modelling
Justin Lyon, CEO, Simudyne.
Pioneered by Doyne Farmer, agent-based modelling is at the heart of market microstructure theories, outperforming traditional efficient market frameworks even when the agents possess ‘zero intelligence’. Perukrishnen Vytelingum, Rory Baggott, Namid Stillman, Jianfei Zhang, Dingqiu Zhu, Tao Chen and Justin Lyon simulate fundamental and momentum-driven agents interacting with a central limit order book, trading Hang Seng index futures. Calibrating their model to market data, they find that transaction costs vary with order size much more than anticipated according to Bloomberg’s widely-used transaction cost analysis formula. (Link to paper: Agent-based Liquidity Risk Modelling for Financial Markets )
Trading creates volatility
Jean-Philippe Bouchaud & Guillaume Maitrier.
According to financial economics textbooks, volatility is caused by new information reaching the market, and prices reflect this information. Not so, according to market microstructure experts who argue that volatility is caused by trading itself. Guillaume Maitrier and Jean-Philippe Bouchaud may have settled this question once and for all with a careful empirical study that brings together three apparently unrelated things: the square root law of price impact, random walks of prices and the impact of order imbalances. Using public tape data for index futures and stocks, they find that a crucial parameter, the long-range correlation between metaorders, plays a decisive role in ensuring that trading creates volatility. (Link to paper: The Subtle Interplay between Square-root Impact, Order Imbalance & Volatility: A Unifying Framework )
The toxic flow problem
Álvaro Cartea & Leandro Sanchez-Betancourt.
Market makers and brokers love trading with uninformed traders (often equated with retail) but live in fear of being picked off by informed traders, who leave them with inventory that is about to rapidly change in price. In the past, quants have tackled the problem of avoiding such ‘toxic flow’ but their models only worked over a limited time horizon. Álvaro Cartea and Leandro Sanchez-Betancourt use a Hamilton-Jacobi-Bellmann approach to extend this to infinite times, providing rules for inventory growth rates based on market volatility and transaction costs. As a bonus, they provide an algorithm that allows practitioners to apply their research on lit order books. (Link to paper: [2503.18005] A Simple Strategy to Deal with Toxic Flow )
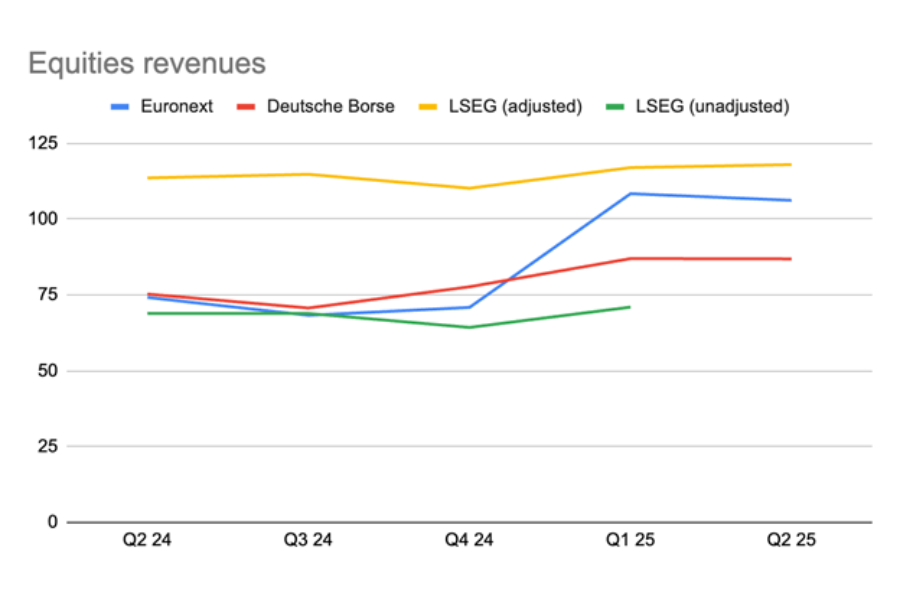
Euronext reported a 7.5% year-on-year (YoY) data revenue increase. LSEG’s exchange data revenues have been combined with equities, flattering that segment. Deutsche Boerse buries its figures in the footnotes of its accounts. And industry experts are fuming about the lack of transparency.
In LSEG’s H1 results presentation, it revealed that LSE market data and SEDOL, ISIN and LEI reference data sets, previously recorded in the data and analytics (data and feeds) category, would be added to the markets (equities) figures. Revenue from the Millenium Information Technology (MIT) business, previously recorded under data and analytics (workflows), have also been recategorised under markets (equities).
With these adjustments, LSEG’s equity revenues have drastically ‘increased’, overtaking European competitors Euronext and Deutsche Boerse by a considerable margin.
Equity revenues
The group has stated that the changes have been made to better reflect how its business sectors are managed operationally.
While its market data feeds are now rolled into the equities business, LSEG’s main data and analytics business is driven by Workspace, a Bloomberg Terminal competitor to replace Eikon from 30th June. The data and analytics business reported €1.1 billion in Q2, down 10% from Q1 and up 1.9% YoY.
The cost of data is a contested topic, with reports by Market Structure Partners and Substantive Research published earlier this year alleging price gouging and excessive fee hikes across European exchanges.
Niki Beattie, CEO of Market Structure Partners, told Global Trading, “It is quite extraordinary that the regulation allows trading venues to generate data revenues separately from trading but does not expect them to account for it in a transparent manner. Instead, regulators have had to come up with a load of arbitrary guidelines about costs of production and margins but have no data in the accounts with which to reconcile the outcomes.”
Niki Beattie, CEO, Market Structure Partners
The sector was also subject to questions at Euronext, whose advanced data solutions business reported €65.2 million in Q2, up 7.5% YoY.
“This dynamic performance reflects the contribution of Global Rate Set Systems [acquired in 2023], strong appetite from retail and growing monetisation of diversified datasets,” the firm said.
During its earnings call, Euronext’s head of cash equity and data services Nicolas Rivard stated, “Over the last years we have been developing new products based on Euronext proprietary data. Some data providers are competing with our solutions, but our data is valuable for clients. Our data business is very competitive, there is still a strong demand from clients.”
CEO Stéphane Boujnah added, “We have a very strong, robust growing data business, which is based on fundamental needs of clients and not on far and aspirational expectations.”
Deutsche Boerse Group consolidates its market data revenues with other revenues including connectivity fees within the trading and clearing segment, and steers its executives away from mentioning it on earnings calls. In Q2, the ‘other’ category of financial derivatives, which includes “Eurex data and Eurex other”, generated a reported €60.2 million. In cash equities, ‘other’ – including “Xetra data, listing and Xetra other” – contributed €42 million of the sector’s overall €86.9 million in revenues.
Since Beattie’s report earlier this year, she said, “Issues persist and there has been no improvements around transparency. Disappointingly, the general consensus is that the recent European Commission consultation on the regulatory technical standards for the definition of reasonable commercial basis is unlikely to result in any changed language and will be implemented as is.”
She went on to warn that such practices could harm European competitiveness: “Policymakers who say they want innovation should follow through with actions that pave the way for growth. I increasingly speak to innovators who are going to the US to develop financial market products because it is too hard to get the data here.”
At Euronext, equity market revenue and income was up 9.5% YoY to €106.2 million, and down 2% QoQ. Equity markets were the second largest contributor to the group’s profits this quarter, behind the Capital Markets and Data Solutions business. Cash equity trading and clearing made up €93.4 million (a 16.2% YoY increase), while financial derivatives trading and clearing provided €12.8 million – a 22.9% decline YoY.
Although its €1.5 billion in Q2 net revenue was the strongest of the European exchange cohort, Deutsche Boerse’s cash equities revenues fell behind Euronext’s. The group reported €86.9 million, up 15% YoY and down 0.1% QoQ.
Deutsche Boerse stated, “Following a sharp equity market correction at the beginning of the second quarter of 2025 as a result of emerging trade conflicts, cash equity trading benefited overall from a combination of solid corporate data, stable macroeconomic conditions and continued high liquidity in the market. The German blue-chip index DAX reached a new all-time high at the beginning of June before the markets moved sideways in the further course of the quarter.”